Enhancing Student Data Analysis with Python

In today’s data-driven education environment, effectively managing and analyzing student data is paramount. My recent work on a Python-based Student Data Analysis System showcases my expertise in building scalable solutions that streamline data processing, visualization, and reporting. This blog highlights the system’s design, features, and the value it brings to educational institutions.
Project Overview
The Student Data Analysis System is a desktop application built using PyQt5 for the graphical user interface, Pandas for data manipulation, and libraries such as XlsxWriter and ReportLab for exporting detailed reports. The application addresses the needs of academic institutions by offering tools to analyze and report on student data across two primary categories:
- Enrolled Students: Analyze and report active student trends across terms, campuses, and genders.
- Graduated Students: Track graduation rates, completion trends, and qualification breakdowns.
This system ensures accuracy and efficiency in processing Excel files and provides visually appealing, interactive reports in both Excel and PDF formats.
Application Interface
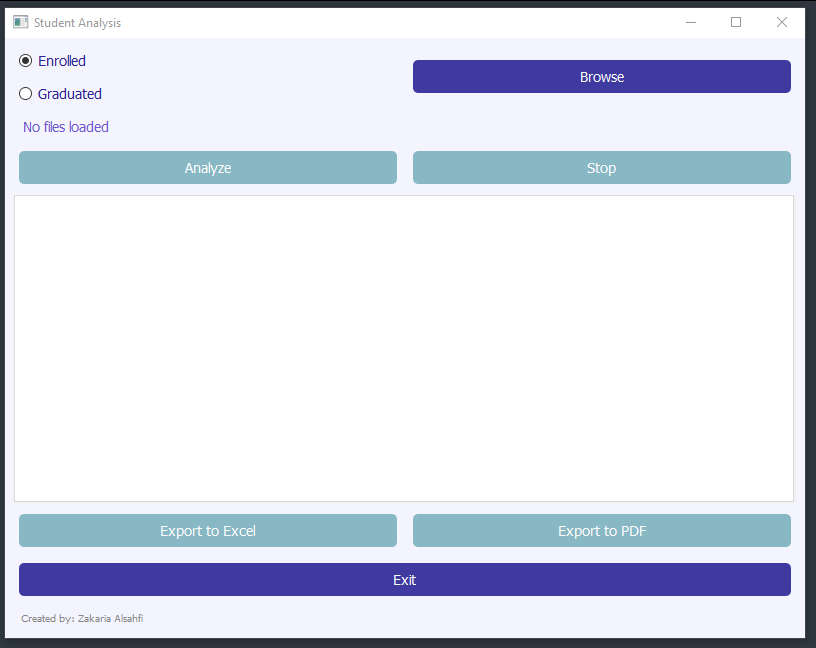
The following screenshot demonstrates the clean and intuitive design of the Student Data Analysis System:

Key interface components include:
- Data Selection: Users can toggle between analyzing enrolled and graduated students.
- File Management: A “Browse” button allows easy folder selection for input data.
- Action Buttons: Includes options to “Analyze,” “Stop,” “Export to Excel,” and “Export to PDF.”
- Real-Time Feedback: Displays progress updates and file statuses during analysis.
The GUI’s aesthetics and functionality reflect a strong focus on user experience, aligning with the needs of academic administrators and analysts.
Key Features and Highlights
1. Intuitive and Responsive GUI
The GUI, developed using PyQt5, is designed to ensure a seamless user experience. It includes:
- File Management: A file browser for selecting folders containing student data files.
- Progress Monitoring: A real-time progress bar and status updates to keep users informed during data analysis.
- Export Options: Buttons to generate Excel and PDF reports for easy sharing and presentation.
Code Example: GUI Elements
self.browse_button = QPushButton('Browse', self)
self.browse_button.clicked.connect(self.load_files)

self.analyze_button = QPushButton('Analyze', self)
self.analyze_button.clicked.connect(self.analyze_data)
self.analyze_button.setEnabled(False)
The design aesthetics were enhanced with a custom stylesheet:
QPushButton {
    background-color: #3B38A2;
    color: #FEFEFE;
    font-size: 14px;
}
QLabel {
    color: #6D57CF;
    font-size: 14px;
}
2. Multithreaded Processing
To prevent the GUI from freezing during data analysis, the application employs QThread for multithreading. This design ensures smooth user interaction even when processing large datasets.
Code Example: Threaded Analysis
class AnalysisThread(QThread):
    progress_signal = pyqtSignal(str)
    finished_signal = pyqtSignal()

    def run(self):
        try:
            if self.analysis_type == 'enrolled':
                self._run_enrolled_analysis()
            else:
                self._run_graduated_analysis()
        except Exception as e:
            logger.error(f"Analysis failed: {e}")
3. Comprehensive Data Processing
Using Pandas, the system consolidates data from multiple files, cleanses it, and generates meaningful tables. Highlights include:
- Year-Term Analysis: Tracks student enrollment trends across terms and years.
- Academic Year Insights: Generates tables for academic years, segmented by gender and enrollment status.
- Custom Metrics: Calculates metrics like completion rates and percentage changes over time.
Example: Processing Data for Enrolled Students
def prepare_data(self, folder_path):
    files = [os.path.join(folder_path, f) for f in os.listdir(folder_path) if f.endswith('.xlsx')]
    consolidated_data = [pd.read_excel(file).fillna({'REGSTATUS': -1, 'GSTATUS': -1}) for file in files]
    return pd.concat(consolidated_data, ignore_index=True)
4. Advanced Reporting
The application supports exporting results in Excel and PDF formats, complete with dynamic charts. Reports include detailed tables for:
- Enrollment by Year and Term
- Graduation Rates and Trends
- Campus-Specific Insights
Example: Chart Integration in Excel
def add_chart_to_sheet(writer, sheet_name, table):
    chart = workbook.add_chart({'type': 'line'})
    chart.add_series({'values': f"='{sheet_name}'!A1:A10"})
    worksheet.insert_chart(0, 0, chart)
PDFs are generated with ReportLab, incorporating both data tables and visual charts:
def generate_pdf_per_sheet(excel_file, output_dir, chart_dir):
    xls = pd.ExcelFile(excel_file)
    for sheet in xls.sheet_names:
        df = pd.read_excel(xls, sheet_name=sheet)
        doc = SimpleDocTemplate(os.path.join(output_dir, f"{sheet}.pdf"))
        # Add tables and charts to the PDF
        doc.build(elements)
5. Robust Logging and Memory Management
The system integrates detailed logging to track errors and progress using a custom logger. Persistent memory ensures previously analyzed files are not reprocessed, improving efficiency.
Example: Logging
logger = get_logger(__name__)
logger.info("Starting analysis...")
Challenges and Achievements
Challenges
- Handling Large Datasets: Optimizing memory usage during data consolidation.
- Dynamic Charting: Developing reusable charting functions for varied report types.
Achievements
- Improved Performance: Leveraged efficient file handling to reduce processing time.
- Scalability: Designed a modular architecture that supports adding new analysis types.
- Error Resilience: Integrated robust error handling and logging.
Why This Project Matters
This project demonstrates my ability to integrate advanced data processing techniques with user-friendly design. By merging the technical rigor of Python programming with practical usability, the Student Data Analysis System addresses real-world needs in academia.
