Building a Comprehensive Data Validation and Reporting Tool with Python

In a world driven by data, maintaining data quality is essential for informed decision-making. Whether it’s analyzing student records, financial data, or operational metrics, inconsistencies in data can lead to incorrect insights. To address these challenges, I developed a Data Validation and Reporting Tool that automates quality checks, ensures compliance, and provides clear, actionable insights through detailed reports.
This post walks through the features, design, and technology behind the tool.
Project Overview
The Data Validation and Reporting Tool is a Python application designed to validate large datasets (e.g., Excel files) against predefined rules. It detects errors, evaluates compliance metrics, and generates comprehensive reports in both Excel and PDF formats. The tool is equipped with an intuitive user interface, dynamic visualizations, and robust error reporting to make data validation accessible and effective.
Key Highlights:
- Automated Validation: Checks column types, formats, and values.
- Customizable Rules: Supports rule configurations via JSON files.
- Dynamic Reporting: Provides compliance scores, charts, and summaries.
- Localization Support: Fully compatible with Arabic text and RTL (right-to-left) languages.
Application Interface
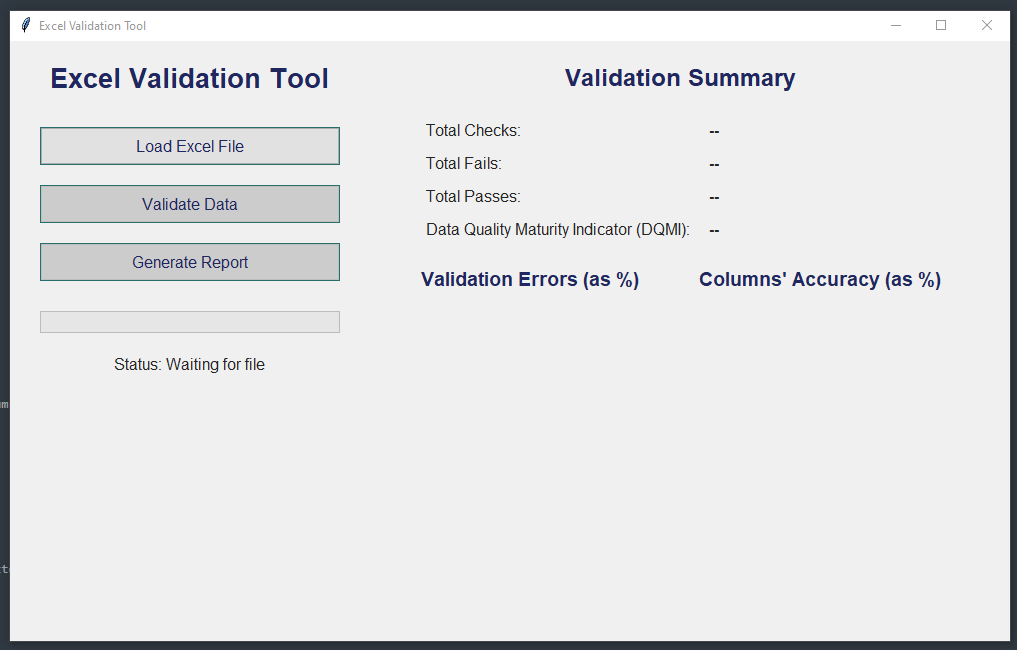
Below is a screenshot of the application’s interface:

The application is split into two primary sections:
- Control Panel:
- Load Excel files for validation.
- Start the validation process with a single click.
- Generate detailed reports after validation.
- Validation Summary:
- Total Checks: Number of checks performed on the dataset.
- Total Fails: Number of failed validations.
- Total Passes: Number of successful validations.
- DQMI: The Data Quality Maturity Indicator, a calculated score representing overall data compliance.
The interface is built with Tkinter and styled for simplicity, usability, and clarity.
Key Features in Detail
1. User-Friendly GUI
The application’s Tkinter-based GUI ensures a seamless experience. Designed with a clean layout and intuitive controls, it allows users to:
- Load files directly via a file browser.
- Monitor progress through a responsive progress bar.
- View validation summaries and compliance metrics.
- Generate detailed reports with a single button click.
Code Example:
self.load_btn = ttk.Button(self.left_frame, text="Load Excel File", command=self.load_excel)
self.validate_btn = ttk.Button(self.left_frame, text="Validate Data", command=self.validate_data, state=tk.DISABLED)
self.report_btn = ttk.Button(self.left_frame, text="Generate Report", command=self.generate_report, state=tk.DISABLED)
2. Advanced Data Validation
The validation process is powered by customizable rules stored in JSON files. Each rule is tailored to check specific aspects of the dataset, such as:
- Column Presence: Ensures all required columns are present.
- Type Validation: Confirms columns contain the expected data type (e.g., integers, dates).
- Range Checks: Verifies numerical values fall within a specified range.
- Lookup Validation: Matches values against predefined lists (e.g., valid genders or course codes).
- Date Format Validation: Checks date formats for consistency.
Code Example:
def validate_length(column_data, length=10):
    return column_data.astype(str).str.fullmatch(fr'\d}').value_counts().get(False, 0)
3. Dynamic Reporting
The tool generates both Excel and PDF reports, enriched with visualizations and compliance summaries. These reports include:
- Compliance Charts: Gauge charts for metrics like DQMI.
- Validation Errors: Bar charts showing the most common issues.
- Correctness Percentages: Displays accuracy for each column.
Using FPDF and Plotly, the reports are visually appealing and easy to interpret.
Code Example:
def generate_gauge_chart(score, target, title, filename):
    fig = go.Figure(go.Indicator(
        mode="gauge+number",
        value=score,
        title={'text': title},
        gauge={'axis': {'range': [0, 100]}, 'steps': [{'range': [0, target], 'color': "lightgray"}]},
    ))
    fig.write_image(filename)
4. Localization Support
The tool is designed to handle both English and Arabic datasets. By integrating libraries like Bidi and Arabic Reshaper, the application reshapes and renders Arabic text, ensuring compatibility with RTL languages in both the GUI and reports.
Code Example:
reshaped_title = arabic_reshaper.reshape(chart_title)
bidi_title = get_display(reshaped_title)
5. Modular Architecture
The codebase is modular, with dedicated scripts for each functionality:
- validators.py: Handles all validation logic.
- report_generator.py: Generates PDF and Excel reports.
- utils.py: Contains helper functions for file handling and column normalization.
This modularity ensures the tool is easy to maintain and extend.
Challenges and Solutions
Challenges
- Handling Large Datasets: Validating thousands of rows while maintaining performance.
- Dynamic Report Generation: Creating visually consistent reports for varying datasets.
- Arabic Text Rendering: Ensuring proper alignment and formatting for Arabic text.
Solutions
- Used multithreading to handle large files without freezing the GUI.
- Integrated FPDF and Plotly for professional-quality visualizations.
- Applied Bidi and Arabic Reshaper for accurate Arabic text rendering.
How It Works: End-to-End Workflow
- Load Data:
- Users select an Excel file via the GUI.
- The file is loaded and preprocessed (e.g., column names normalized).
- Validate Data:
- The tool validates each column against predefined rules.
- Compliance scores and validation errors are calculated.
- Generate Report:
- A detailed report is generated, including charts, tables, and summaries.
- Reports are exported as PDF and Excel files for easy sharing.
Final Thoughts
The Data Validation and Reporting Tool demonstrates my ability to combine data science principles with practical software development. By automating the validation process and providing actionable insights, this tool helps organizations maintain high data quality standards, enabling better decision-making.
