Power BI Dashboards & Reports
Explore my diverse Power BI portfolio! This section is a showcase of the versatility of Power BI, with a variety of interactive dashboards and reports I’ve created using Microsoft Power BI. Each project demonstrates my ability to turn raw data into insightful visualizations that drive informed decision-making. Whether it’s sales analysis, financial reporting, or operational metrics, these dashboards highlight my expertise in data modeling, DAX, and Power Query. Discover how I use Power BI to provide clear and actionable insights tailored to different business needs.
2025
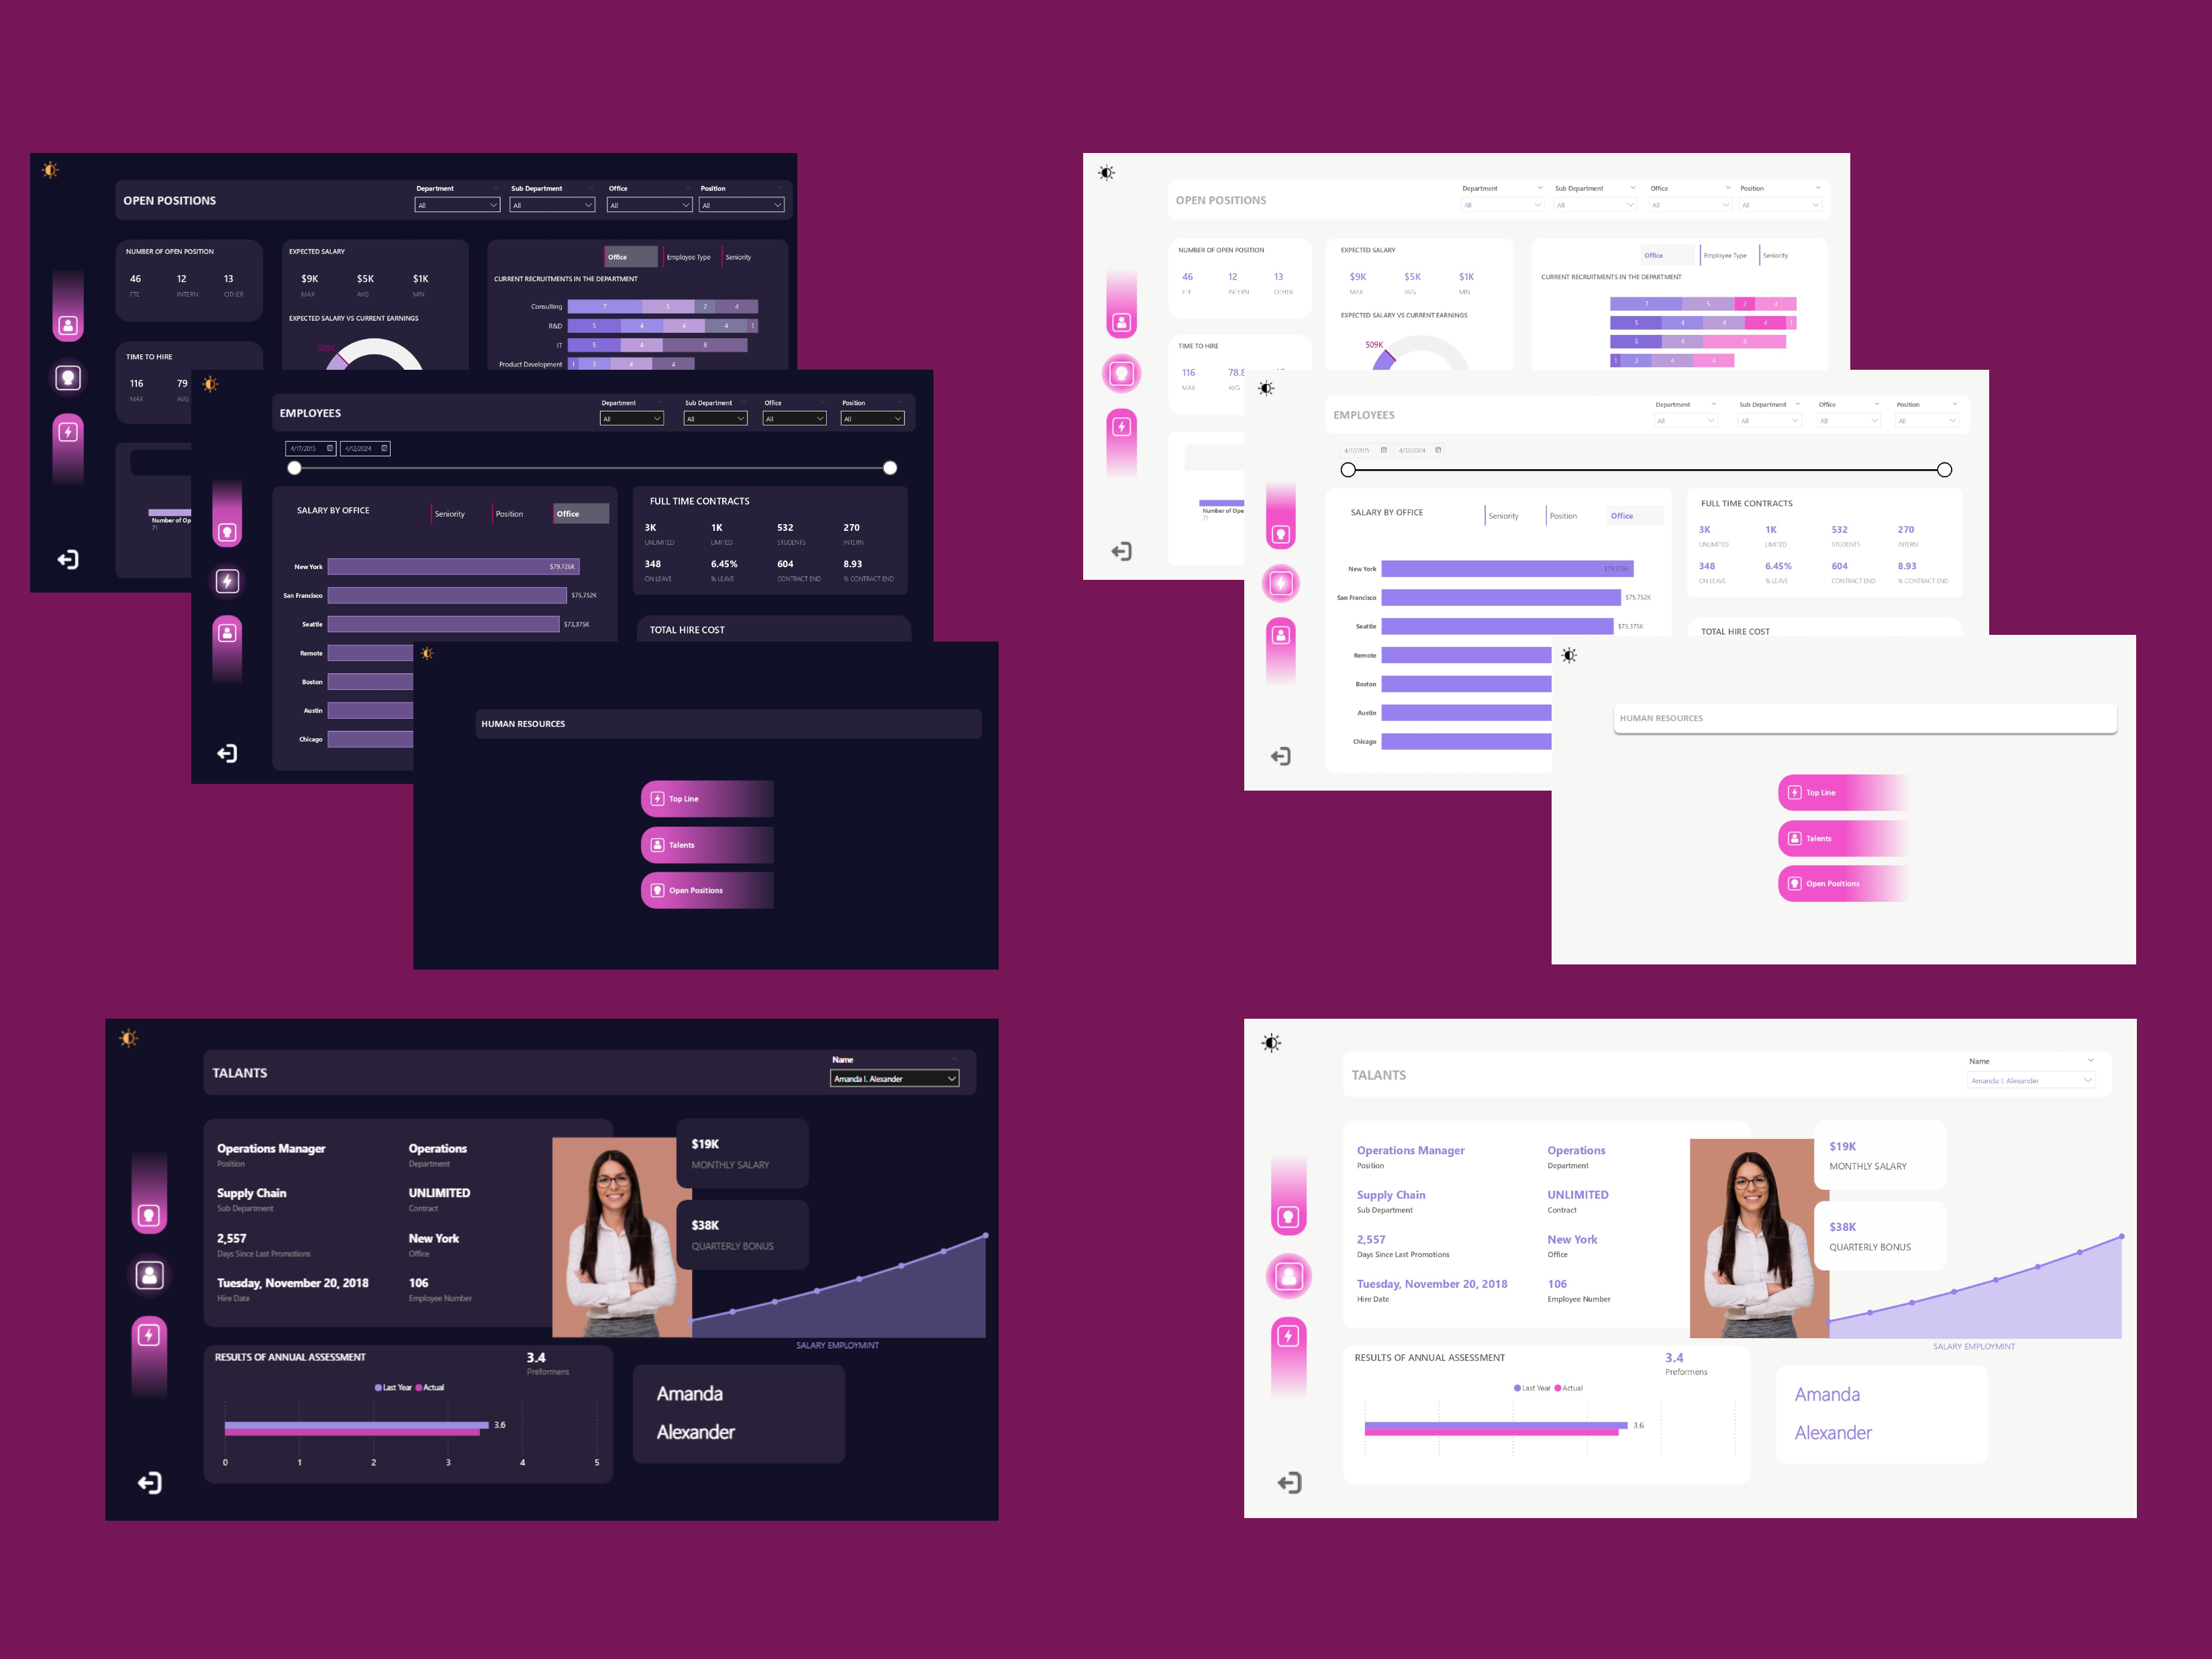
Human Resources Dashboard Overview
This interactive HR dashboard visualizes employee distribution, salary insights, talent assessments, and hiring activities. It empowers HR teams to track workforce metrics, optimize recruitment, and manage employee performance effectively. Dashboard layout inspired by DataTraining.io. Continue reading Human Resources Dashboard Overview
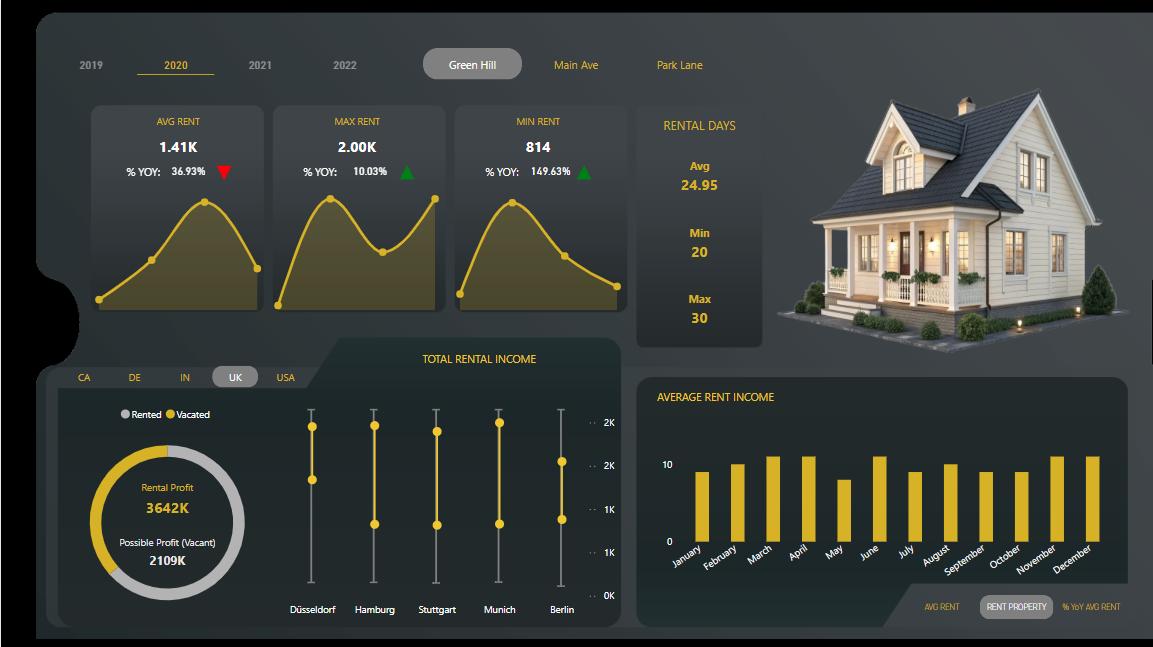
Property Rental Analytics Overview
This dashboard provides a visual summary of key rental market metrics, including average rent, rental duration, income distribution, and profit potential. It helps property managers, investors, and analysts make informed decisions by highlighting trends, performance variations, and opportunities across different regions and time periods. Dashboard design inspired by DataTraining.io. Continue reading Property Rental Analytics Overview
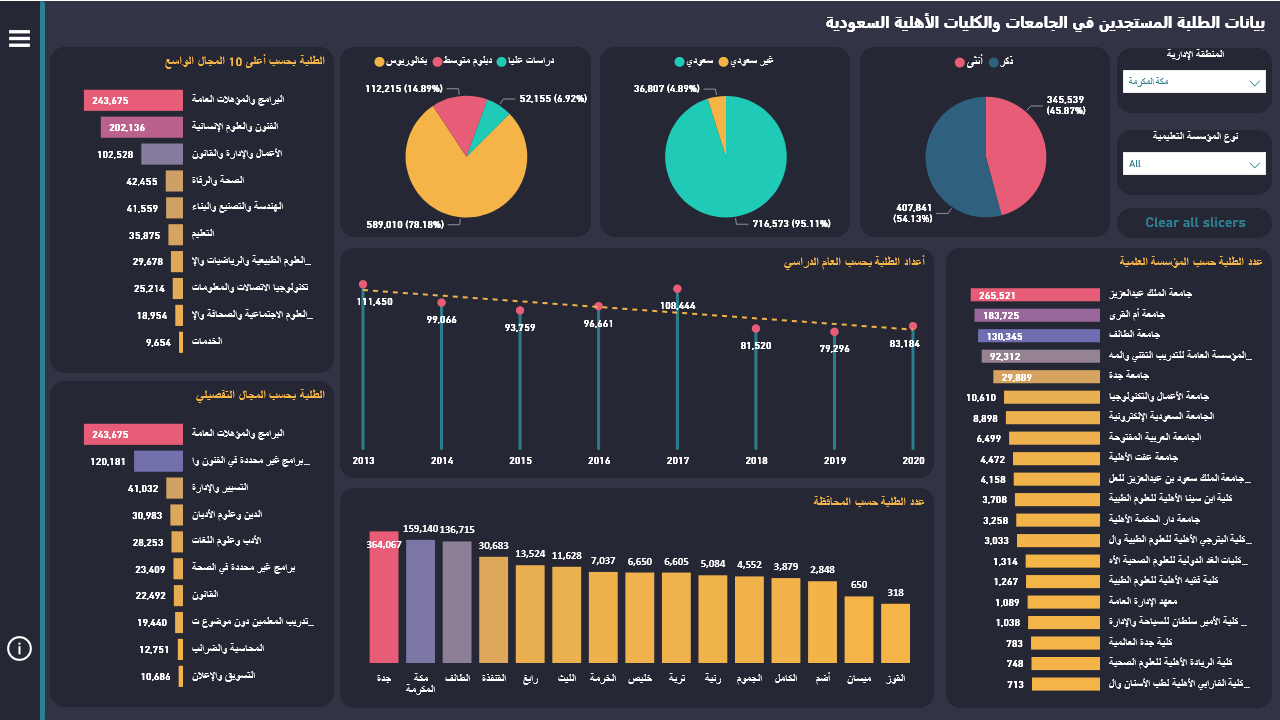
Student statistics in Saudi universities
The dashboard helps universities, policymakers, and educators enhance strategic planning, optimize program offerings, and allocate resources efficiently to strengthen Saudi Arabia’s higher education system. Continue reading Student statistics in Saudi universities
2024
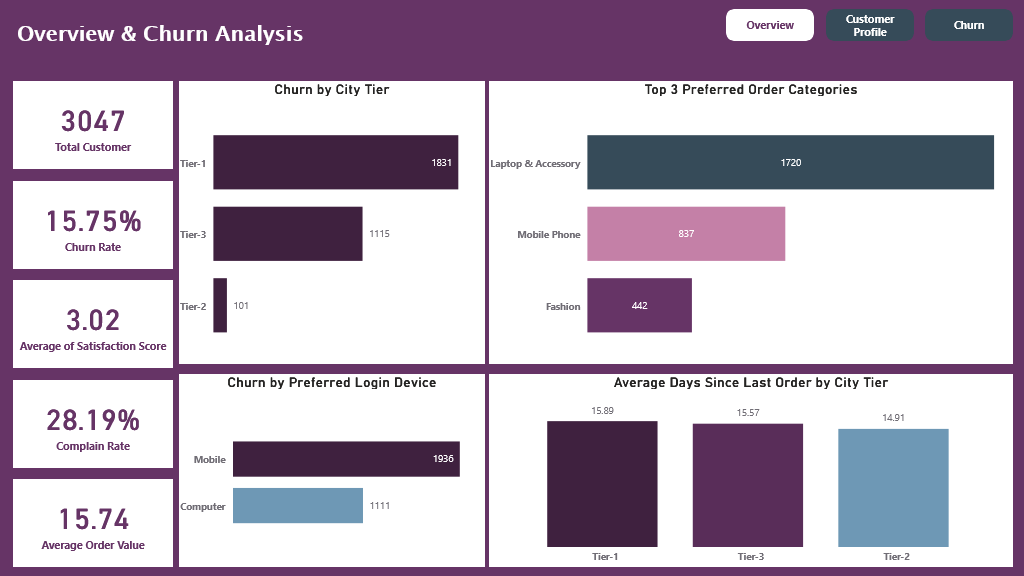
E-commerce Customer Insights
This dashboard provides a concise overview of customer churn and related factors in an e-commerce context, highlighting key metrics such as churn rate, customer satisfaction, and complaint rate. It offers insights into customer demographics and behavior, including gender, marital status, preferred login device, and top product categories. The churn analysis further identifies high-risk segments based on city tier, marital status, and satisfaction level. These insights enable targeted interventions to enhance customer satisfaction, loyalty, and overall business growth. Continue reading E-commerce Customer Insights
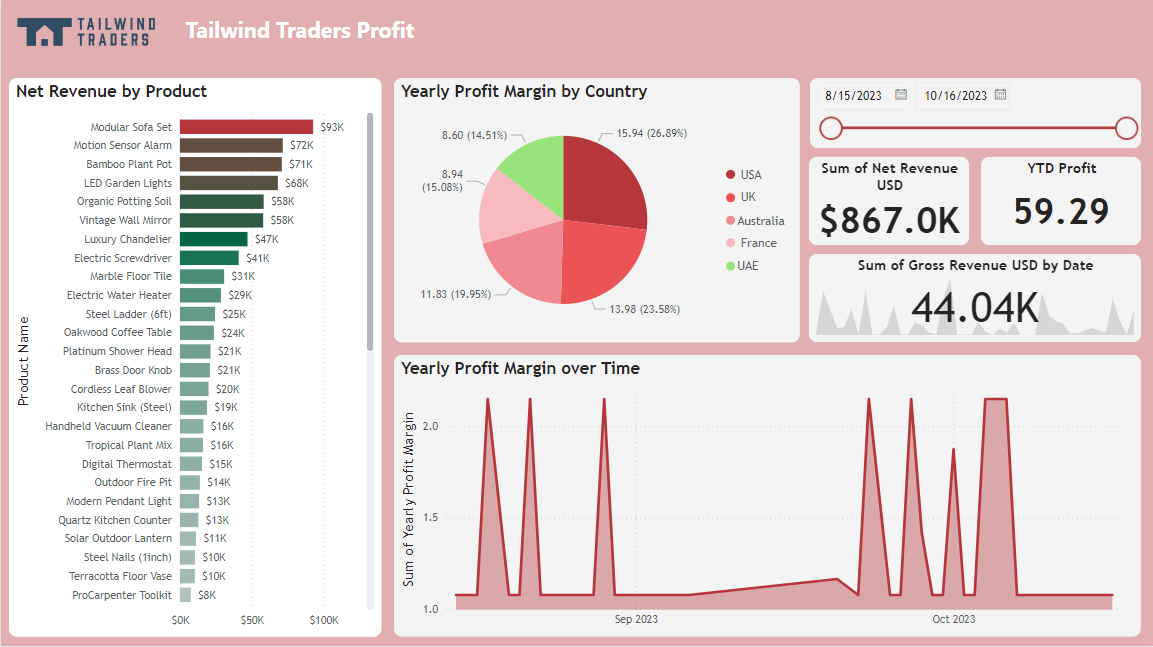
Tailwind Traders Profit Report
The Tailwind Traders Profit Report highlights the company’s financial performance, focusing on net revenue by product and yearly profit margins across different countries. It also tracks profit margin trends over time and provides an overall assessment of the company’s profitability, showcasing strong revenue generation and balanced regional contributions. Continue reading Tailwind Traders Profit Report
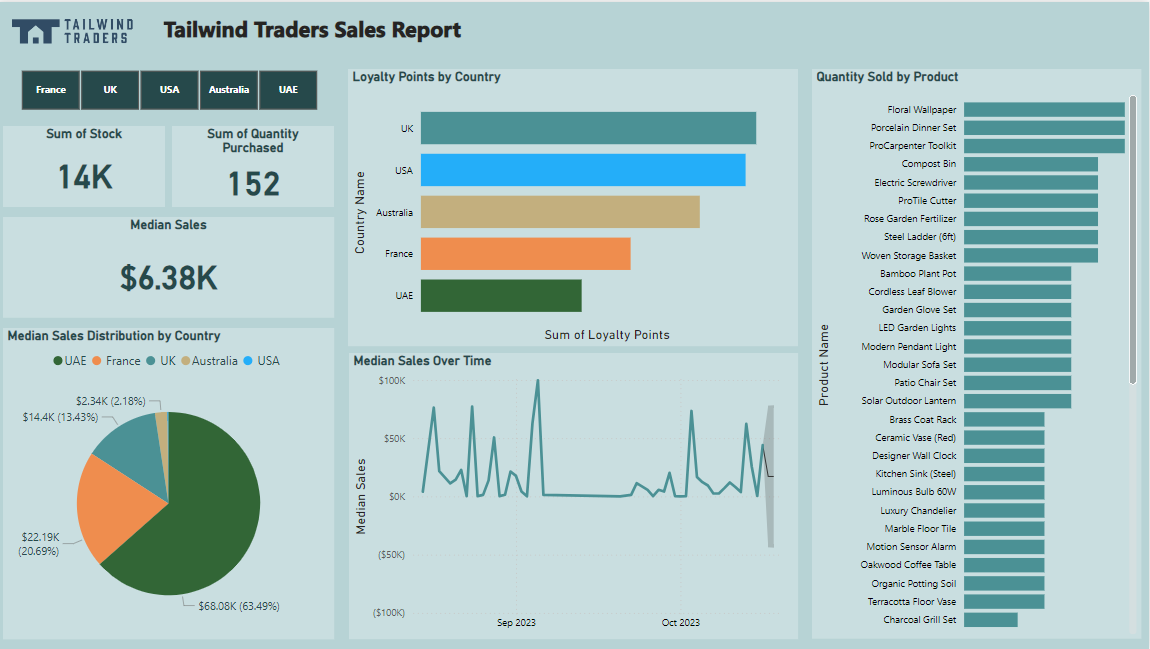
Tailwind Traders Sales Report
This report offers insights into Tailwind Traders’ sales performance across multiple regions. It features key metrics such as stock levels, quantity sold by product, and median sales over time. The report also includes a breakdown of sales distribution by country and loyalty points earned, giving a detailed view of the company’s sales activities. Continue reading Tailwind Traders Sales Report
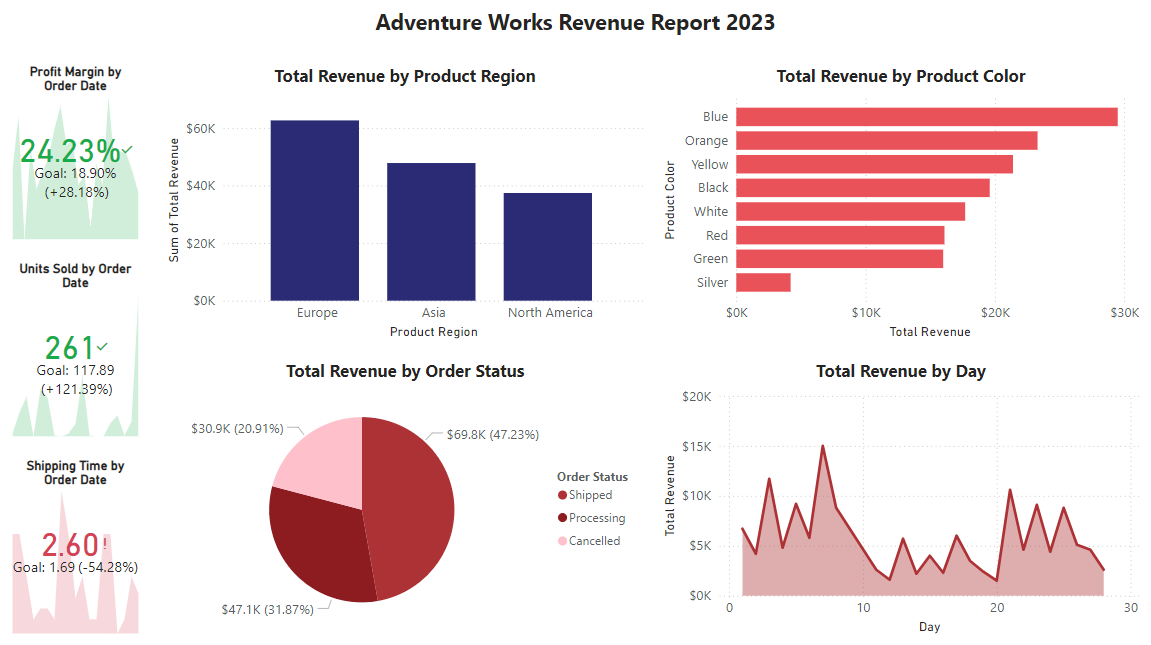
Adventure Works Revenue Report 2023
This report provides an overview of Adventure Works’ sales performance, highlighting key metrics such as stock levels, quantity purchased, and median sales across various countries. The report also showcases loyalty points by country, median sales distribution, and trends over time, offering a comprehensive snapshot of the company’s revenue dynamics. Continue reading Adventure Works Revenue Report 2023
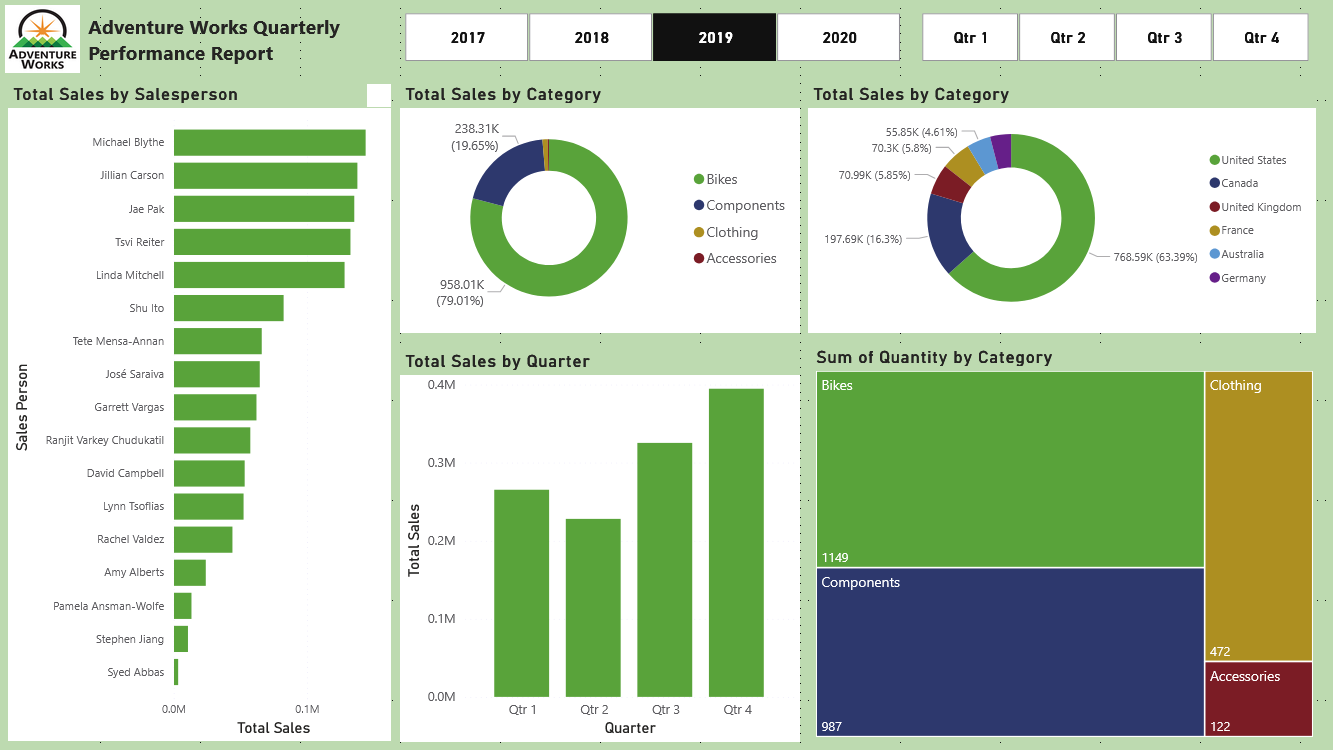
Adventure Works Quarterly Performance
This dashboard offers a comprehensive overview of Adventure Works’ sales performance, highlighting key metrics such as total sales, top performers, product categories, regional distribution, and sales trends over time. It provides valuable insights for identifying sales opportunities, optimizing resource allocation, and driving overall business growth. Continue reading Adventure Works Quarterly Performance
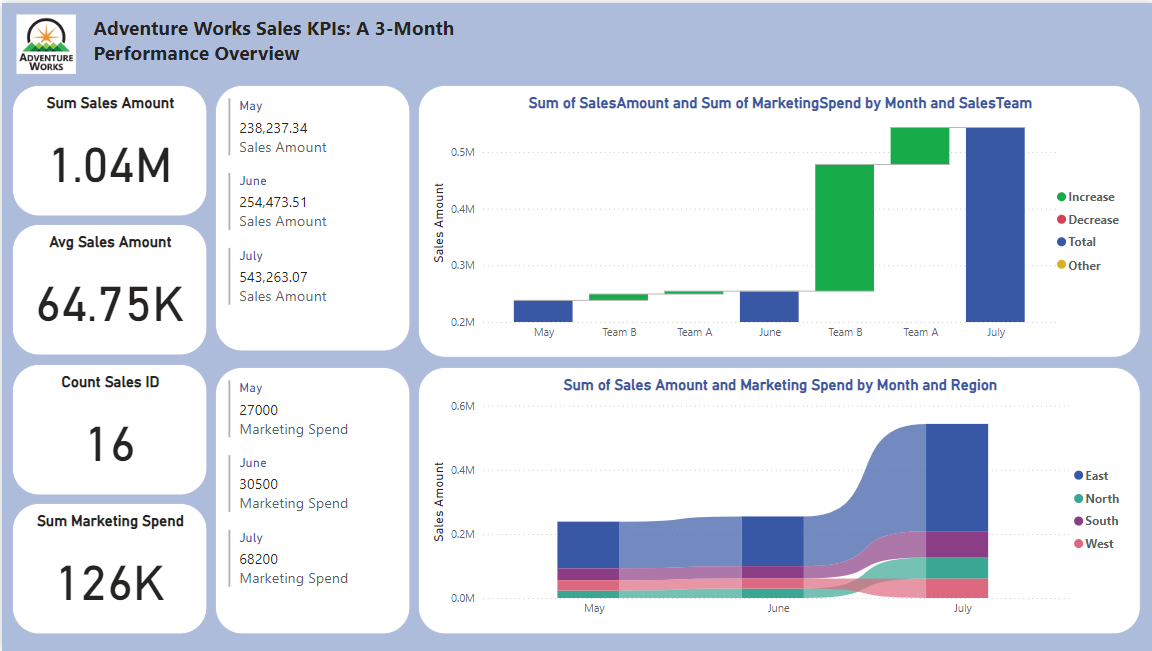
Adventure Works Sales KPIs
This dashboard analysis provides a comprehensive overview of sales performance and marketing effectiveness across different regions.Key findings include significant sales disparities between regions, the impact of marketing expenditure on sales, and the varying success of ad campaigns.These insights can be used to optimize marketing strategies, allocate resources effectively, and drive overall sales growth. Continue reading Adventure Works Sales KPIs
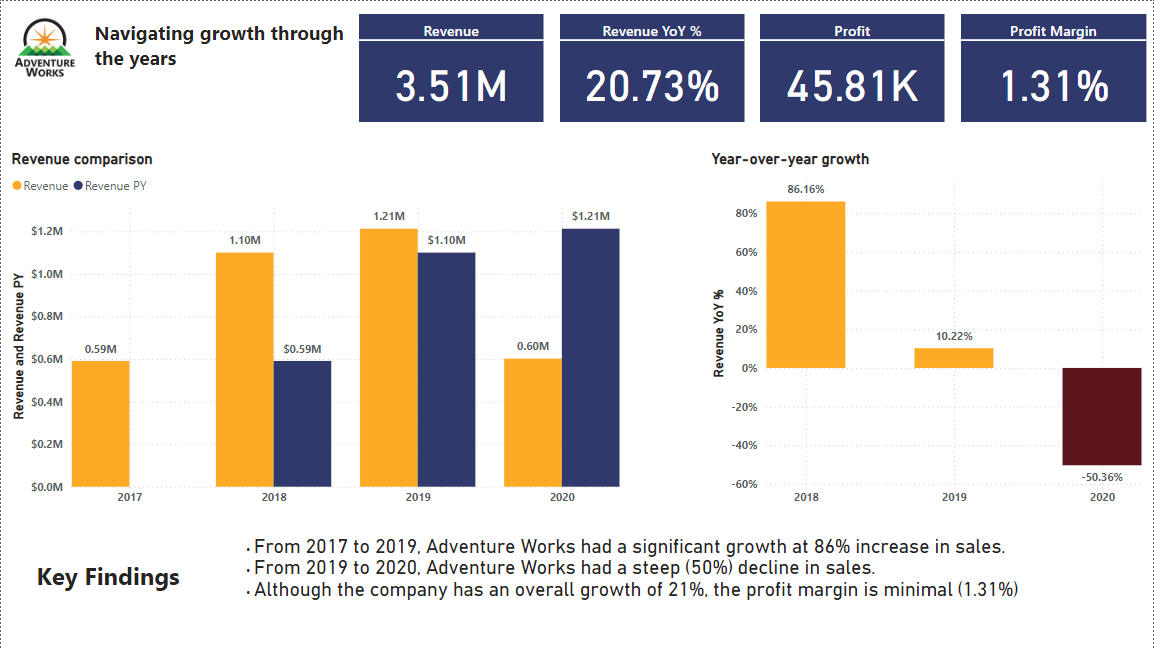
Adventure Works data story
This dashboard provides a high-level overview of Adventure Works’ financial performance, focusing on revenue and profitability trends over time. Key metrics such as total revenue, profit margin, and growth rates are visualized to identify patterns and areas for improvement.The dashboard is designed to help stakeholders understand the company’s financial health, assess the impact of revenue fluctuations on profitability, and identify opportunities to enhance overall financial performance. Continue reading Adventure Works data story
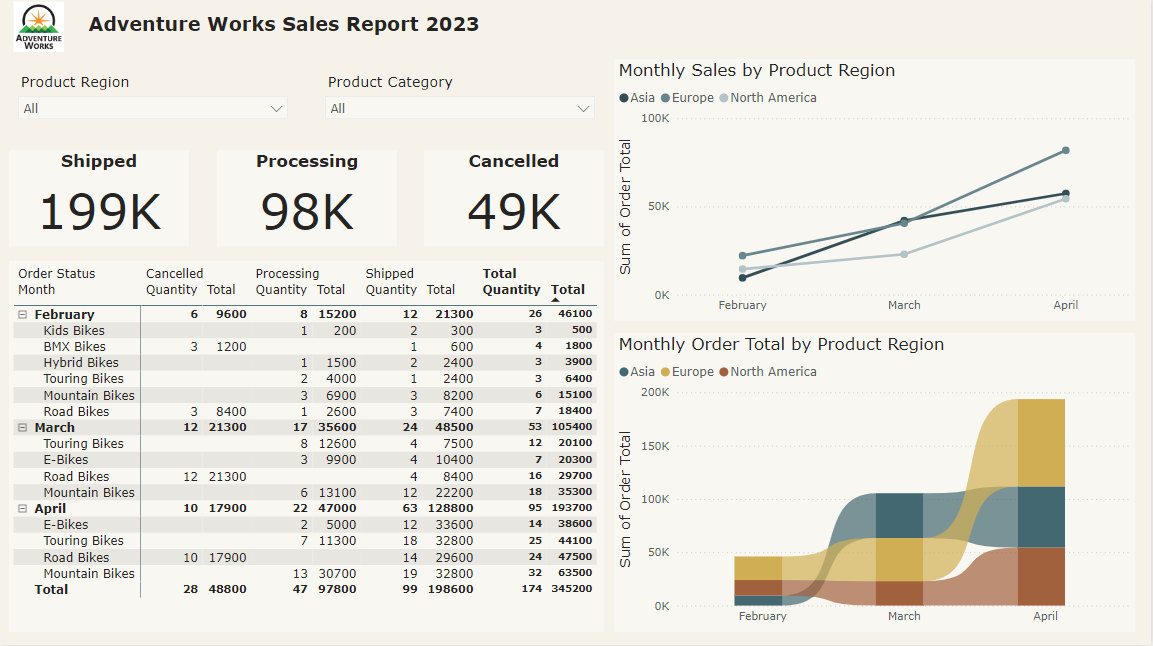
Adventure Works Sales Report
This dashboard provides a comprehensive overview of order performance across different regions and product categories. Key metrics such as total orders, order status, sales growth, and product sales are visualized to identify trends and opportunities. Users can gain insights into product popularity, regional sales performance, and overall business growth. Continue reading Adventure Works Sales Report
2023
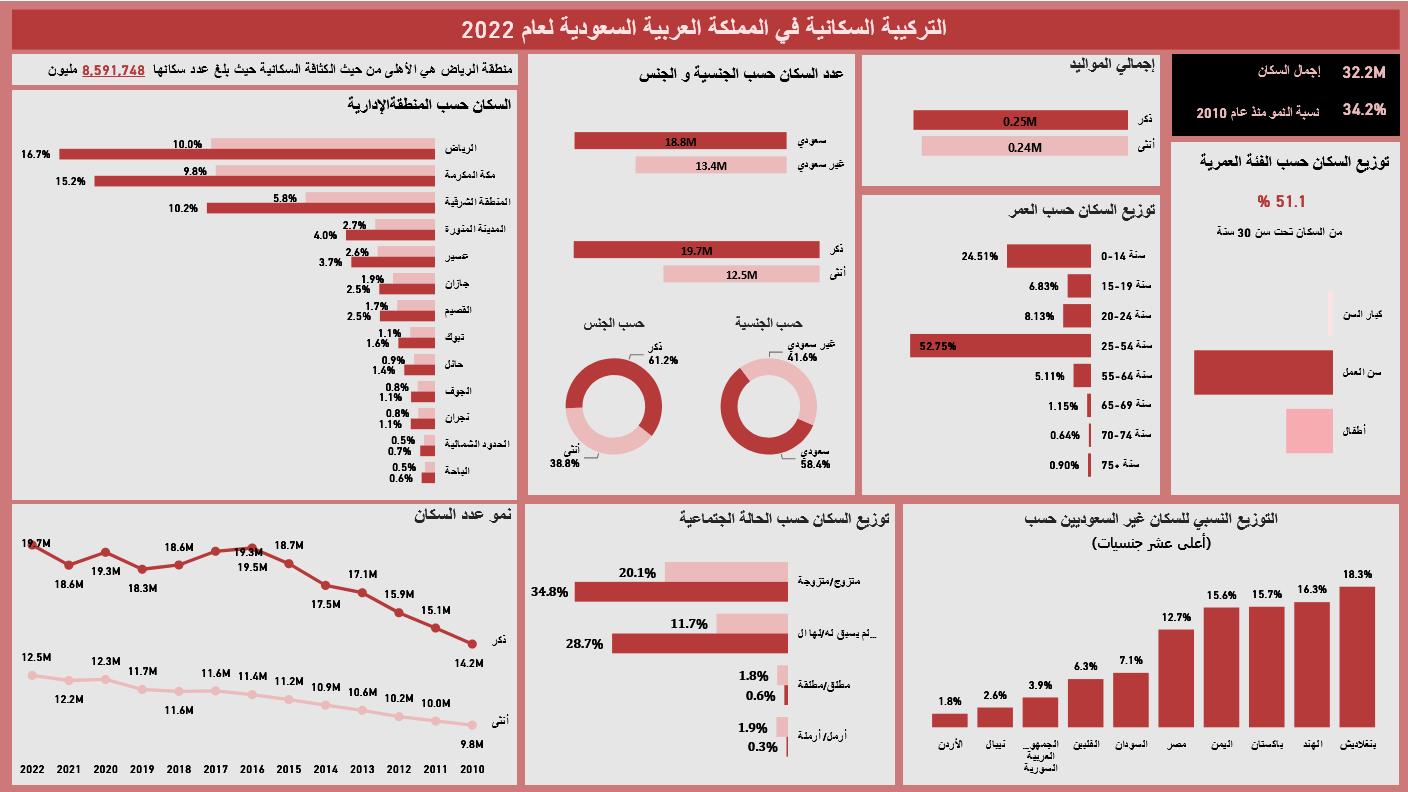
Saudi Arabia Population
This dashboard provides a comprehensive overview of Saudi Arabia’s population for the year 2022. The visualizations and data points presented here offer valuable insights into various demographic aspects, enabling informed decision-making. Continue reading Saudi Arabia Population
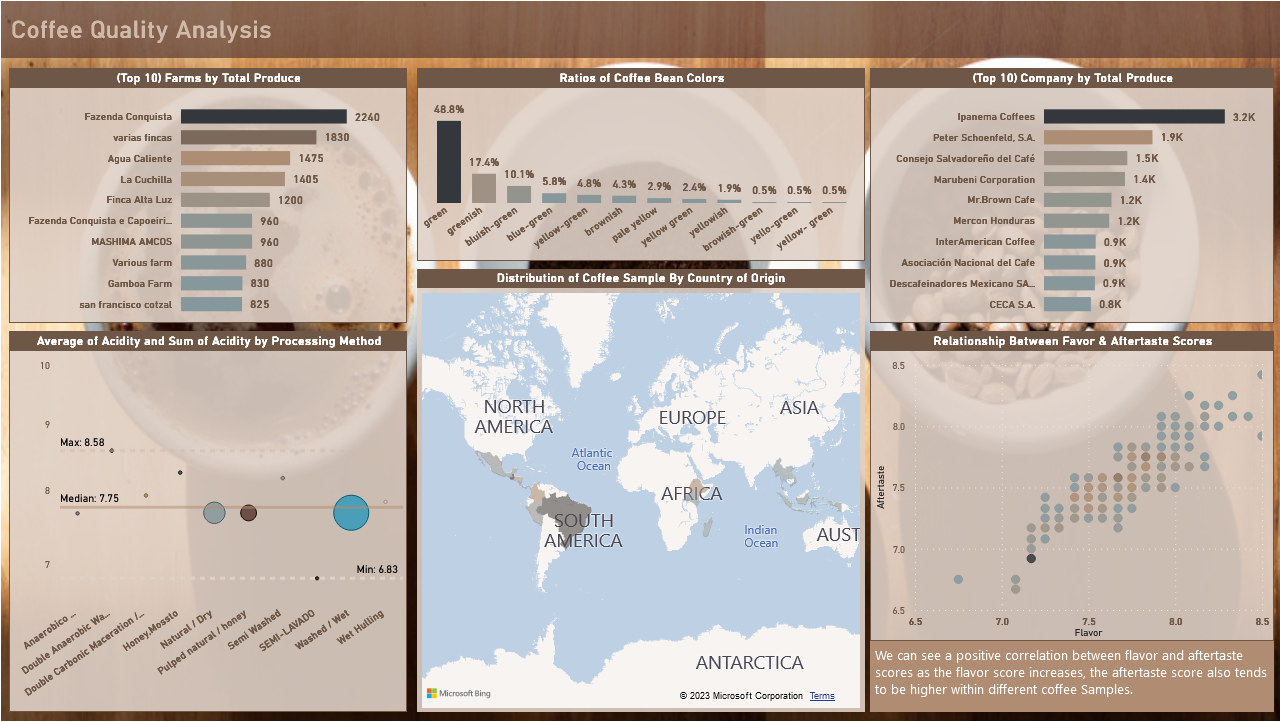
Coffee Quality Analysis
This dashboard provides comprehensive insights into coffee quality data, focusing on key metrics to evaluate the overall quality of coffee. It highlights various coffee types, regions, and processing methods, identifying opportunities to enhance specific coffee varieties and growing locations. Continue reading Coffee Quality Analysis
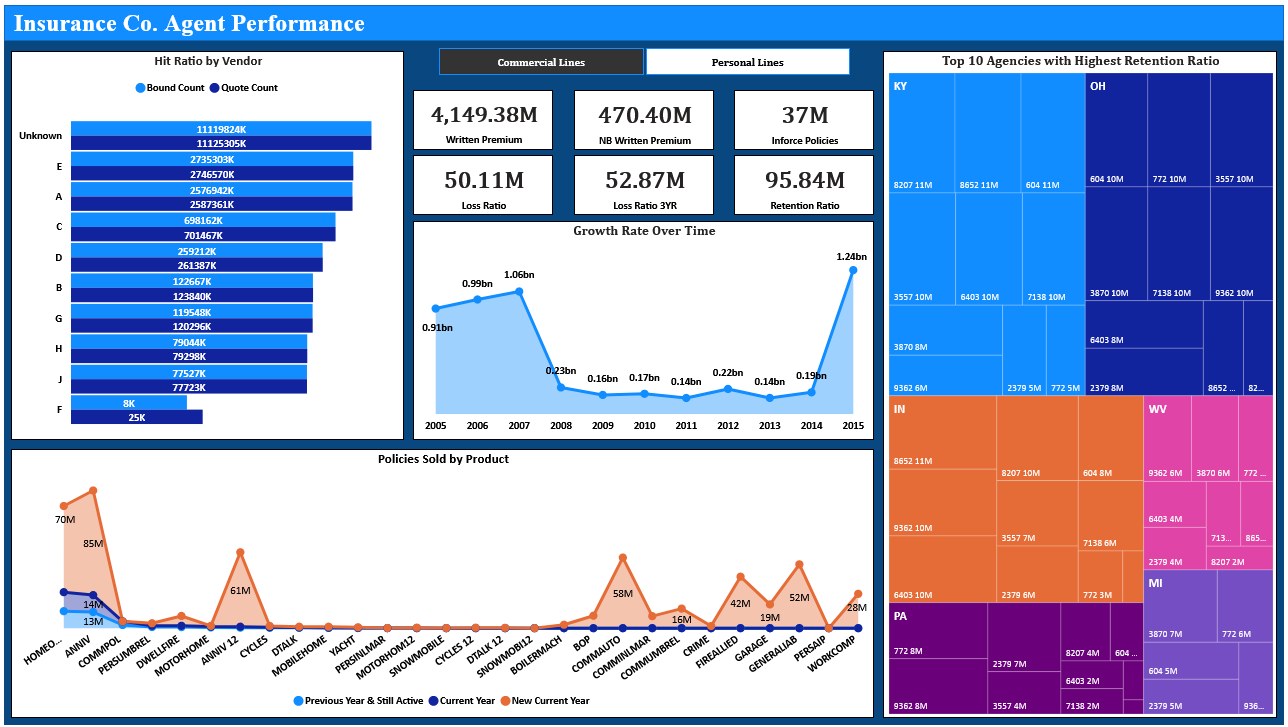
Insurance Co. Agent Performance
This dashboard provides a comprehensive analysis of the performance of agents in an insurance group comprising 10 property and casualty insurance, life insurance, and insurance brokerage companies. The dashboard focuses on key performance indicators (KPIs) to evaluate agent effectiveness and highlight areas for improvement. Continue reading Insurance Co. Agent Performance
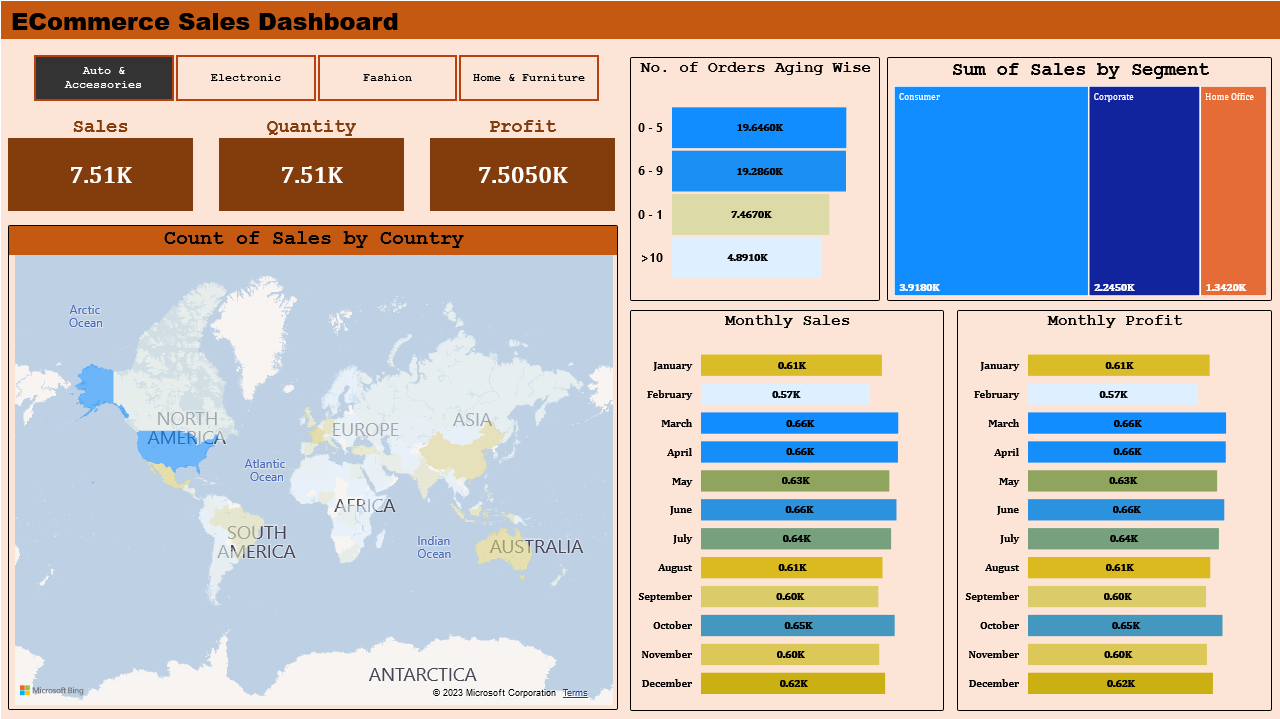
E-Commerce Sales
This dashboard is designed for an Online E-Commerce Company to analyze sales across various product categories. It provides detailed insights into sales trends, quantities, profits, and geographic distribution. The dashboard is equipped with user controls for selecting specific product categories to observe month-wise and product-wise trends. Continue reading E-Commerce Sales
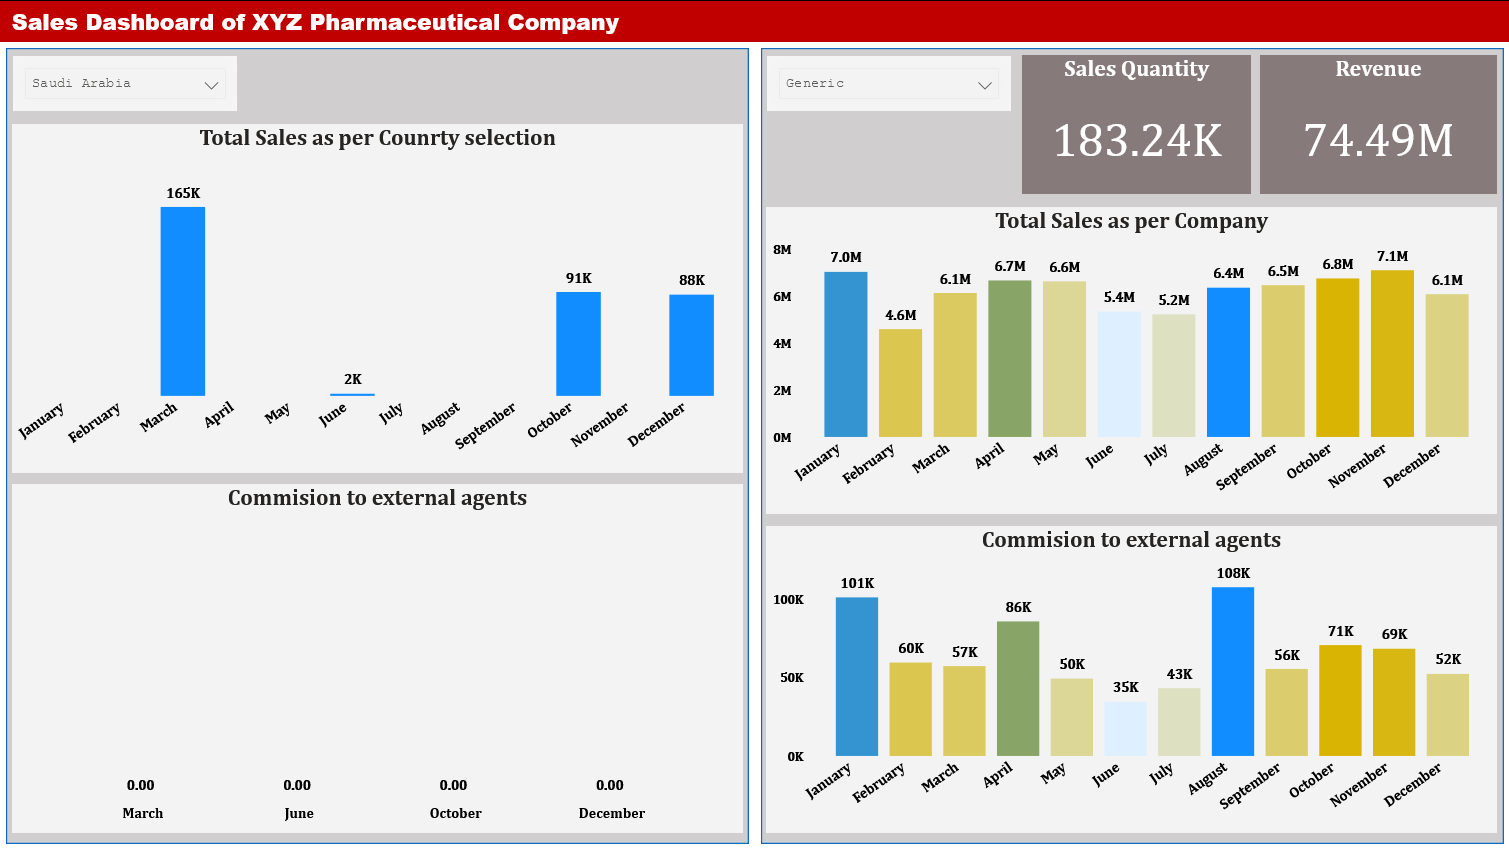
Pharmaceutical Sales
This dashboard is designed to analyze the sales performance of products across various regions and brands for a pharmaceutical company. It provides insights into sales quantities, revenue, and commissions to external agents, with user control functionality for easy data manipulation and visualization. Continue reading Pharmaceutical Sales
2022
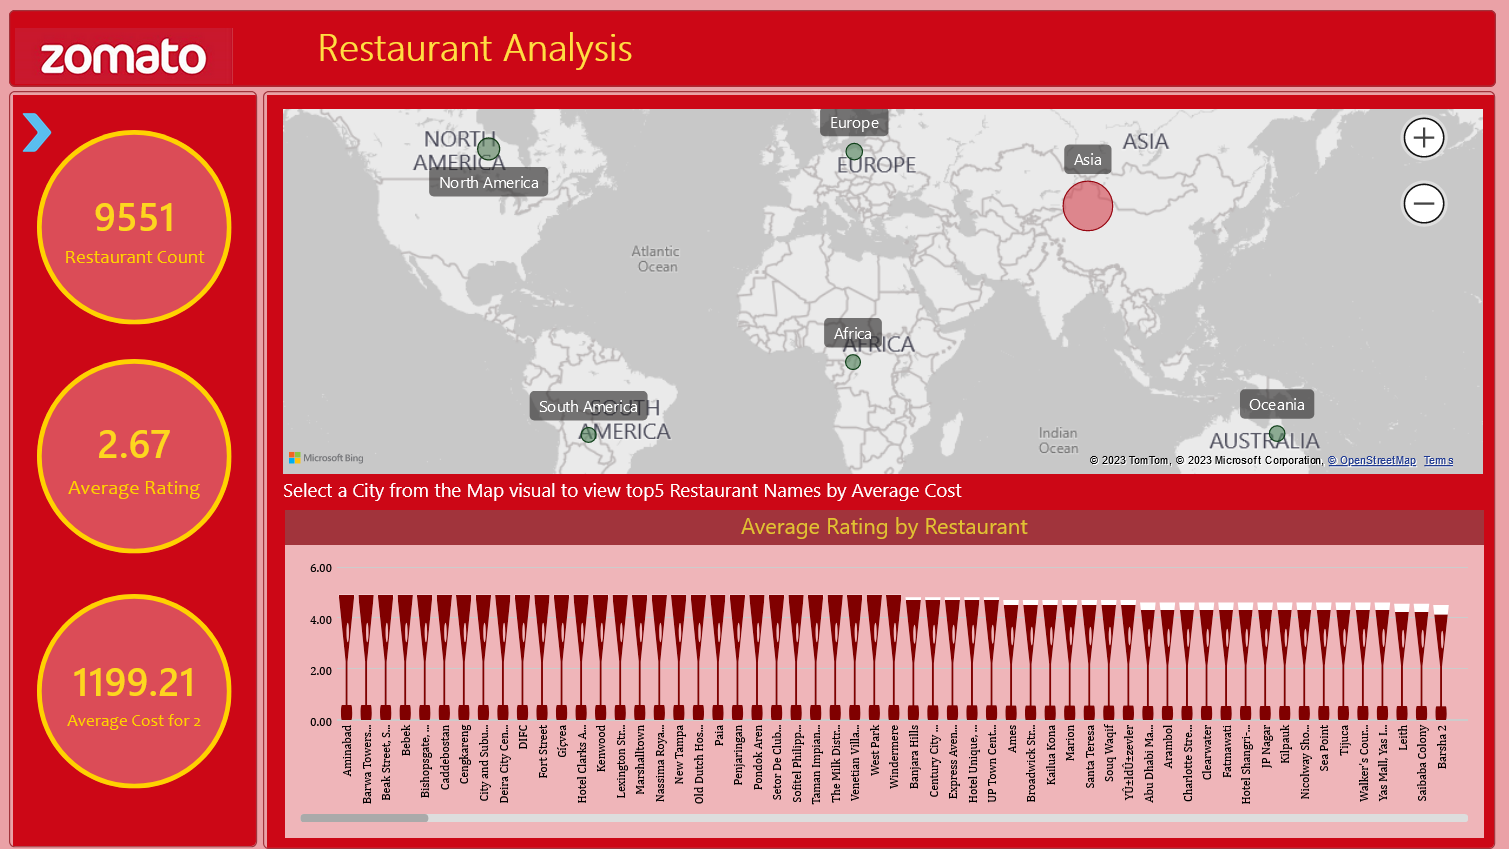
Analyze Zomato's Business Data
This dashboard provides an in-depth analysis of Zomato’s restaurant data, helping to uncover hidden anomalies and accurately judge business performance. It includes key metrics and visualizations that offer insights into restaurant counts, ratings, and average costs across different regions. Continue reading Analyze Zomato's Business Data