Adventure Works Sales KPIs
Power BI Dashboards & Reports , , Links: Veiw
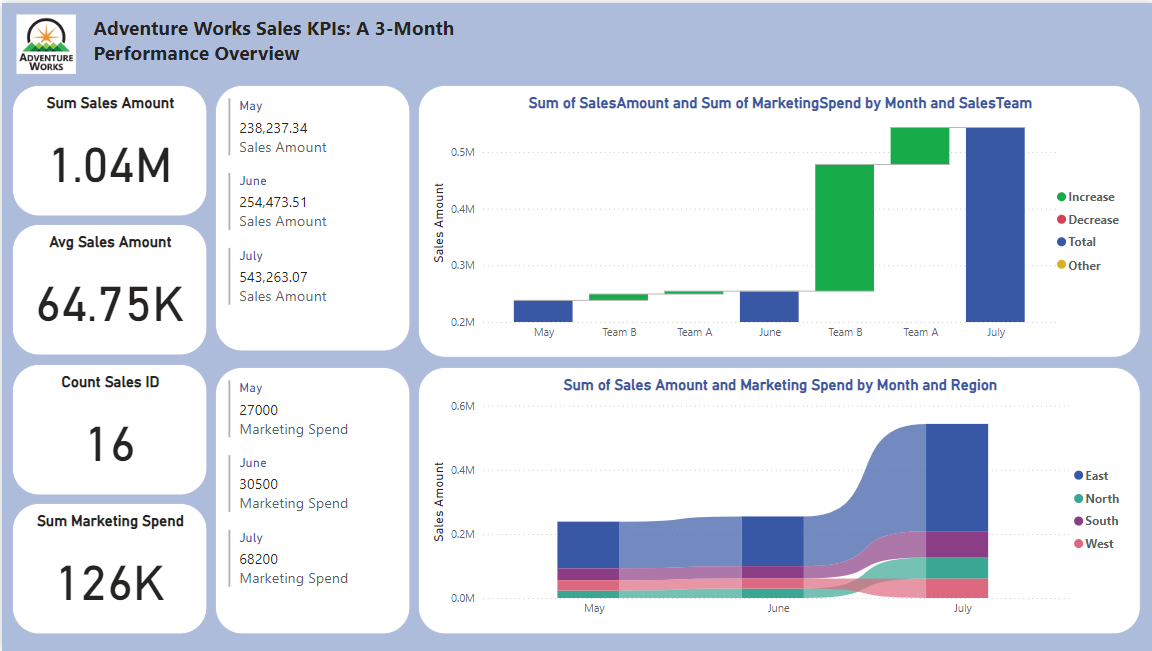
This dashboard analysis provides a comprehensive overview of sales performance and marketing effectiveness across different regions.Key findings include significant sales disparities between regions, the impact of marketing expenditure on sales, and the varying success of ad campaigns.These insights can be used to optimize marketing strategies, allocate resources effectively, and drive overall sales growth.
Key Insights:
- Sales Performance:
- Total Sales: $1.04M over three months with an average of $64.75K per order.
- Order Volume: 16 orders processed during the same period.
- Sales Trend: Sales increased from May to June, then decreased in July.
- Sales by Team:
- Team Performance: Team B (East and South) outperformed Team A (North and West) in terms of sales.
- Sales Growth: Team B experienced significant sales growth in June.
- Marketing Impact:
- Total Marketing Spend: $126K over three months with an increasing trend.
- Marketing Efficiency: While overall marketing expenditure increased, its impact on sales varied by team. Team B saw a higher return on investment compared to Team A.
- Regional Performance: The East region consistently outperformed other regions in both sales and marketing effectiveness.
Overall, the dashboard highlights the strong performance of Team B and the East region. While marketing efforts have contributed to sales growth, optimizing marketing strategies for Team A and the West region is crucial for overall business success.