Analyze Zomato's Business Data
Power BI Dashboards & Reports , , Links: Veiw
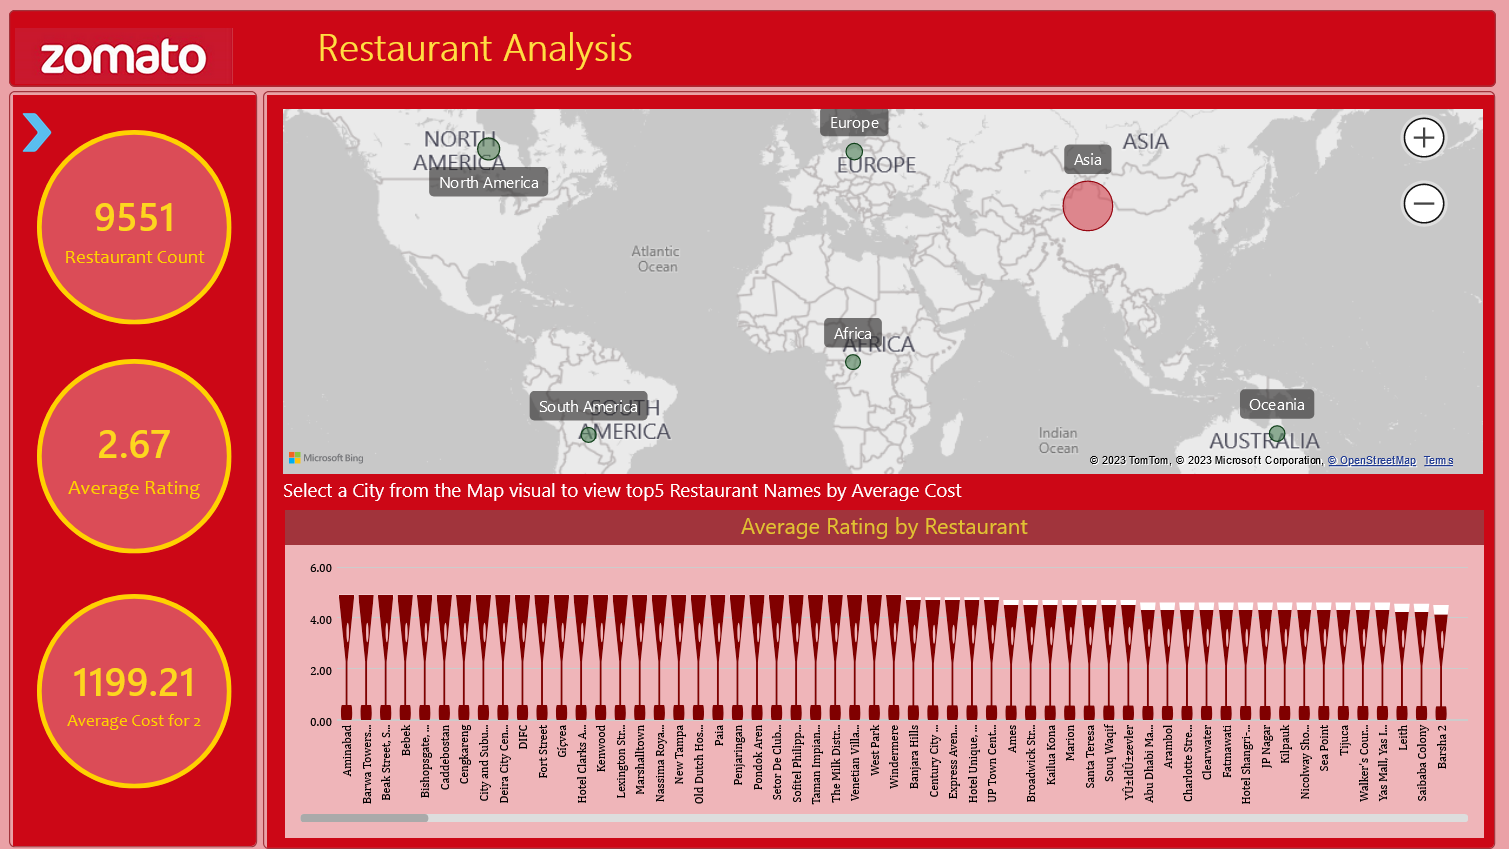
This dashboard provides an in-depth analysis of Zomato’s restaurant data, helping to uncover hidden anomalies and accurately judge business performance. It includes key metrics and visualizations that offer insights into restaurant counts, ratings, and average costs across different regions.
Key Insights:
Overall Metrics:
- Restaurant Count: 9,551
- Average Rating: 2.67
- Average Cost for 2: 1,199.21
Geographic Distribution:
- Restaurants are distributed across various continents including North America, South America, Europe, Africa, Asia, and Oceania.
- Users can select a city from the map to view the top 5 restaurants by average cost.
Average Rating by Restaurant:
- Visualization of average ratings across different restaurants.
- Includes a wide range of cities such as Ahmedabad, Bangalore, New York, London, and more.
City-wise Analysis:
- Detailed view of top restaurants in selected cities.
- Enables comparison of restaurant performance based on location.
Objective:
The primary aim is to analyze Zomato’s business data to identify trends, anomalies, and opportunities for improvement. By understanding these aspects, Zomato can enhance their service, improve customer satisfaction, and boost overall business performance.
This dashboard serves as a valuable tool for Zomato’s owners and management team, providing the necessary insights to make informed decisions and drive strategic growth.