Coffee Quality Analysis
Power BI Dashboards & Reports , , Links: Veiw
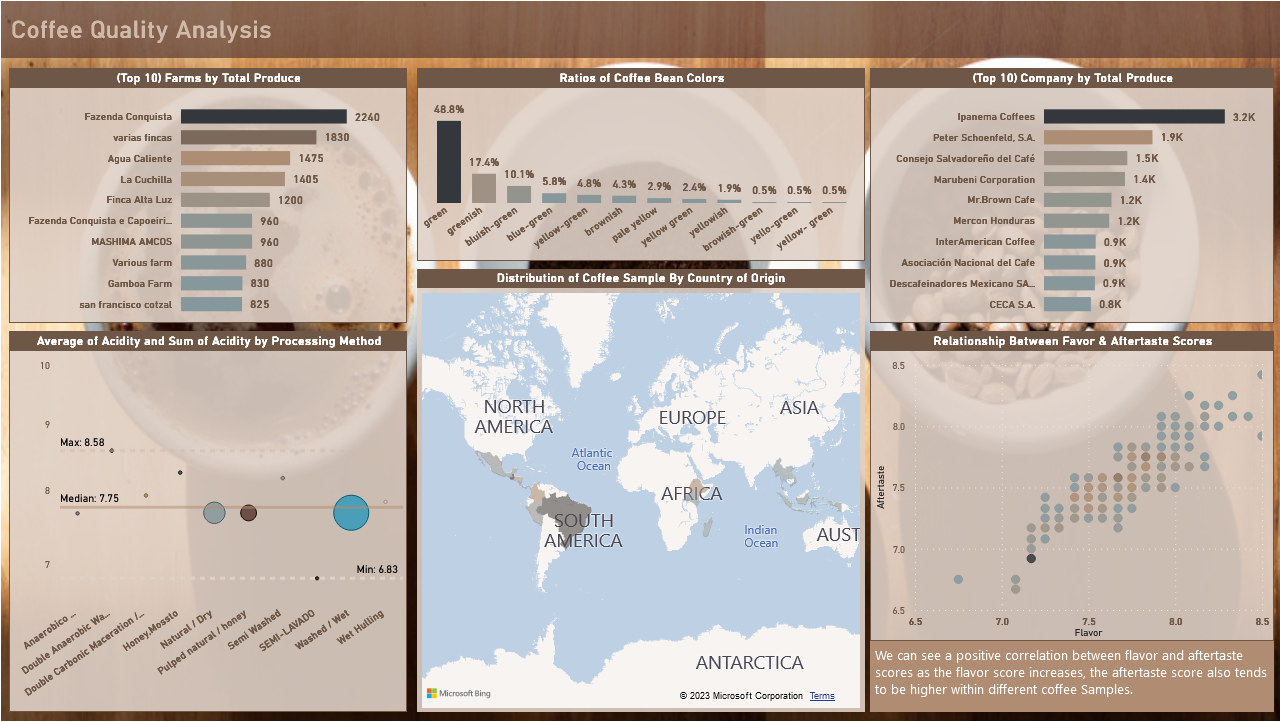
This dashboard provides comprehensive insights into coffee quality data, focusing on key metrics to evaluate the overall quality of coffee. It highlights various coffee types, regions, and processing methods, identifying opportunities to enhance specific coffee varieties and growing locations.
Key Insights:
Top Farms by Total Produce:
- Fazenda Conquista leads with 2240 units.
- Various other farms and their production quantities are listed.
Coffee Bean Colors:
- Dominant color: Green (48.8%)
- Other colors include greenish, bluish-green, pale yellow, etc.
Top Companies by Total Produce:
- Ipanema Coffees tops with 3.2K units.
- Other companies and their production figures are provided.
Geographic Distribution:
- Coffee samples are mapped by country of origin.
- Major regions include South America, Africa, Asia, and more.
Acidity Analysis:
- Average and sum of acidity by processing method.
- Acidity levels vary across different processing techniques.
Flavor and Aftertaste Correlation:
- Positive correlation between flavor and aftertaste scores.
- Higher flavor scores tend to correlate with higher aftertaste scores.
These visualizations enable production managers and quality inspectors to detect issues, identify correlations, and observe trends in coffee quality over time. This information is crucial for taking corrective actions to ensure the production and roasting of optimal coffee.