E-Commerce Sales
Power BI Dashboards & Reports , , Links: Veiw
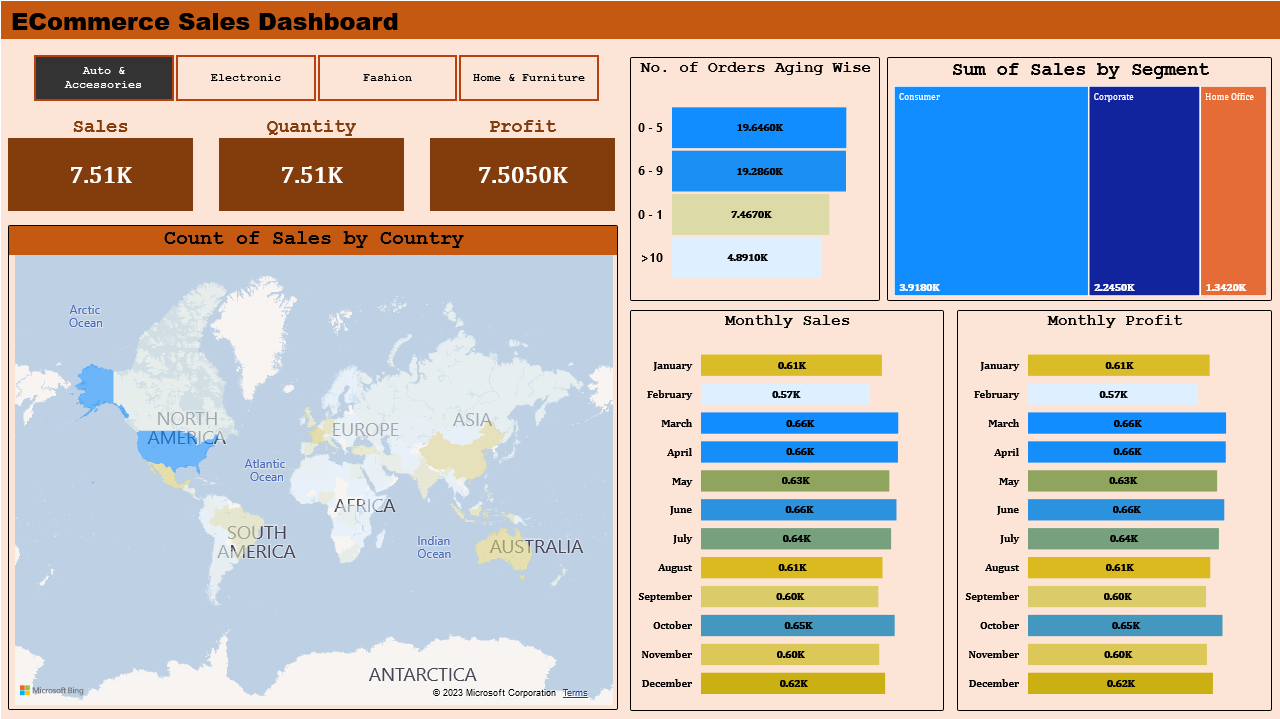
This dashboard is designed for an Online E-Commerce Company to analyze sales across various product categories. It provides detailed insights into sales trends, quantities, profits, and geographic distribution. The dashboard is equipped with user controls for selecting specific product categories to observe month-wise and product-wise trends.
Key Insights:
Sales Metrics:
- Total Sales: 7.51K
- Total Quantity Sold: 7.51K
- Total Profit: 7.5050K
Product Categories:
- User can select from Auto & Accessories, Electronic, Fashion, Home & Furniture.
Sales Segmentation:
- Sum of sales by segment: Consumer (3.9180K), Corporate (2.2450K), Home Office (1.3420K).
Order Aging Analysis:
- Number of orders aging-wise:
- 0-5 days: 19.6460K
- 6-9 days: 19.2860K
- 0-1 day: 7.4670K
10 days: 4.8910K
- Number of orders aging-wise:
Geographic Distribution:
- Count of sales by country, illustrated on a world map highlighting major regions.
Monthly Sales and Profit:
- Detailed month-wise breakdown:
- Sales:
- January: 0.61K
- February: 0.57K
- March: 0.66K
- April: 0.66K
- May: 0.63K
- June: 0.66K
- July: 0.64K
- August: 0.61K
- September: 0.60K
- October: 0.65K
- November: 0.60K
- December: 0.62K
- Profit follows a similar trend with slight variations.
- Sales:
- Detailed month-wise breakdown:
Objective:
The Analytics team aims to enable detailed analysis by product categories, allowing users to select specific categories and observe trends over time. Additionally, they want to include a histogram to analyze the number of shipping days, providing deeper insights into logistics and delivery performance. This comprehensive analysis aids in strategic decision-making to enhance sales and operational efficiency.