E-commerce Customer Insights
Power BI Dashboards & Reports , , Links: Veiw
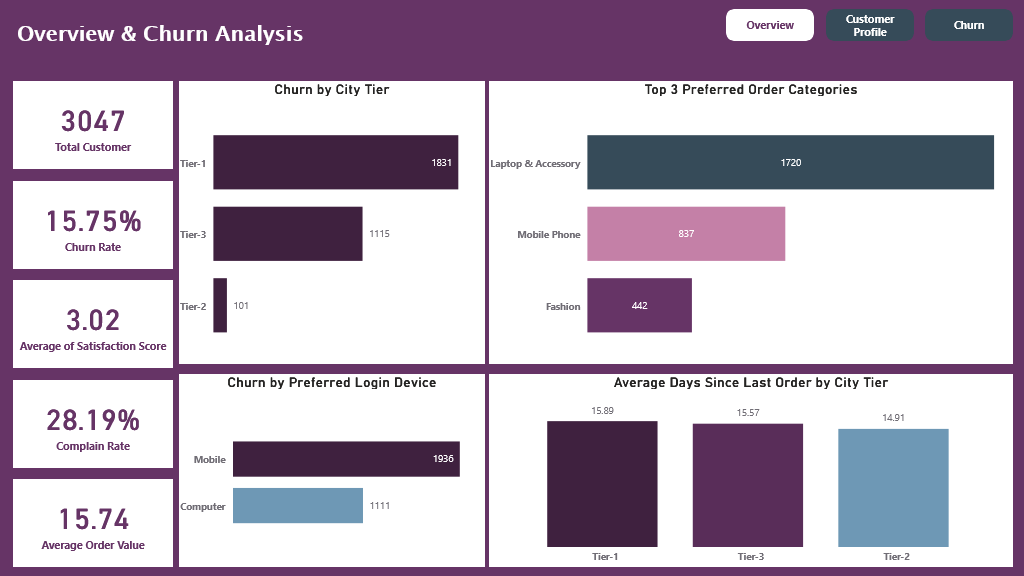
This dashboard provides a concise overview of customer churn and related factors in an e-commerce context, highlighting key metrics such as churn rate, customer satisfaction, and complaint rate. It offers insights into customer demographics and behavior, including gender, marital status, preferred login device, and top product categories. The churn analysis further identifies high-risk segments based on city tier, marital status, and satisfaction level. These insights enable targeted interventions to enhance customer satisfaction, loyalty, and overall business growth.
Key Insights:
- Customer Base & Churn:
- Total Customers: 3,047
- Churn Rate: 15.75% - Indicates a moderate level of customer attrition, warranting attention to retention strategies
- Customer Engagement & Satisfaction:
- Average Satisfaction Score: 3.02 (out of 5) - Suggests room for improvement in customer experience and service levels
- Average Order Value: $15.74 - Provides a baseline for assessing customer spending behavior and identifying high-value segments
- Complain Rate: 28.19% - A significant portion of customers have raised complaints, highlighting potential pain points in the customer journey
- Customer Demographics & Behavior:
- Gender Split: Male customers dominate (59.73%), offering opportunities for targeted marketing to female customers
- Marital Status: Married customers form the largest segment (53.27%), suggesting potential family-oriented product or service offerings
- Preferred Login Device: Mobile devices are favored (63.39%), emphasizing the importance of mobile optimization and app engagement
- Top Preferred Order Category: Laptop & Accessories lead (56.45%), indicating a core customer interest and potential for cross-selling or upselling
- Churn Analysis:
- Churn by City Tier: Tier-1 cities exhibit the highest churn rate (20.81%), suggesting a need to investigate factors specific to these locations
- Churn by Satisfaction Score: Very dissatisfied customers have the highest churn (22.30%), underscoring the critical link between satisfaction and retention
- Churn by Marital Status: Single customers churn at a higher rate (25.88%), potentially indicating different needs or expectations compared to married customers
Additional Notes:
- Data Timeframe: The dashboard appears to present a snapshot of current customer data, without explicit historical trends.
- Data Gaps: The visuals don’t provide insights into customer acquisition, repeat purchase behavior, or the impact of marketing campaigns on churn.
Overall, the dashboard offers valuable insights into customer churn and related factors. To enhance decision-making, consider incorporating historical trends, customer lifetime value analysis, and deeper segmentation based on purchase behavior and engagement metrics.