Human Resources Dashboard Overview
Power BI Dashboards & Reports , , Links: Veiw
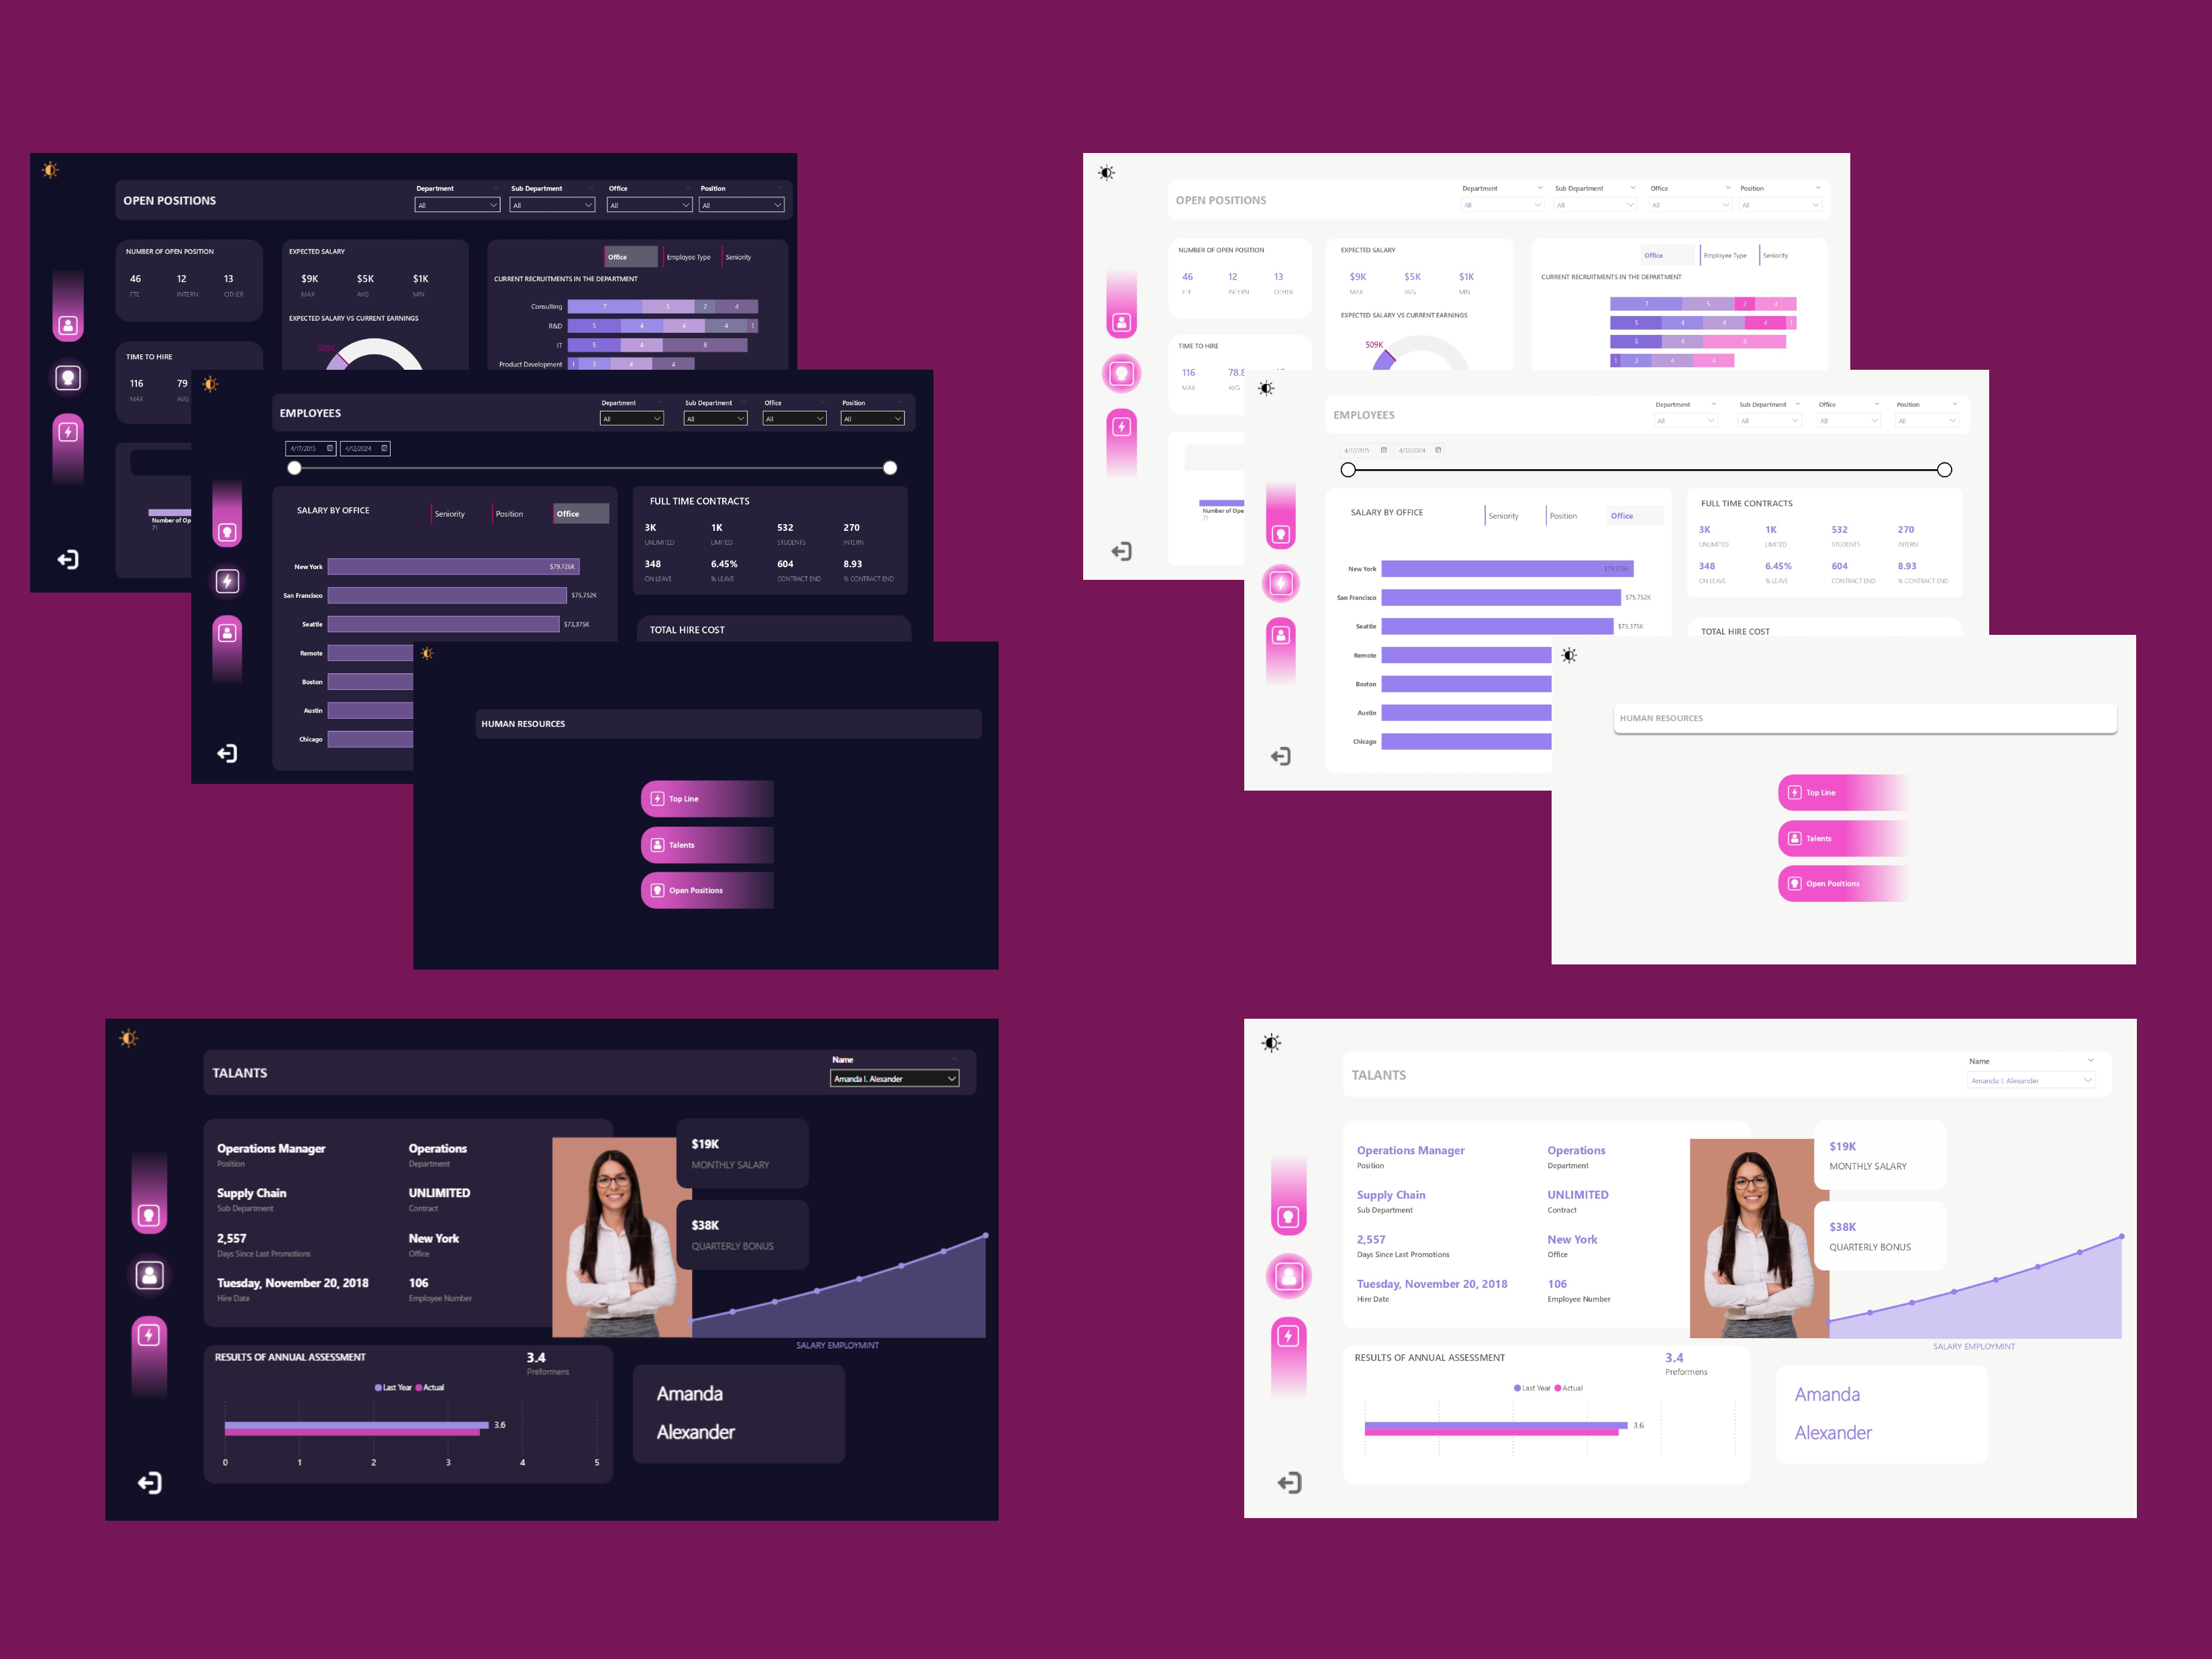
This interactive HR dashboard visualizes employee distribution, salary insights, talent assessments, and hiring activities. It empowers HR teams to track workforce metrics, optimize recruitment, and manage employee performance effectively. Dashboard layout inspired by DataTraining.io.
Key Insights:
Employee Overview
Salary by Position
Data-driven comparison of monthly salaries across key job roles including Data Scientists, Software Engineers, and HR Specialists.
Full-Time Contracts
- Limited: 382
- Unlimited: 186
- Contracted: 66
- Online: 51
- On-site vs Off-site Distribution provided
- Contract Cost Analysis shows a total hire cost exceeding $9.75M
Talent Insights
Employee Profile
Displays key details like department, contract type, salary, bonus, and historical data (e.g. last promotion date).
Example: Amanda Alexander (Operations Manager) with a $19K monthly salary and $38K quarterly bonus.
Performance Assessment
Side-by-side view of last year vs current performance rating.
Open Positions
- Current Openings:
- 46 Internships.
- 12 Contract Roles.
- 13 Full-Time.
- Time-to-Hire tracked by role type (days).
Expected Salary vs Budget
Displays expected salary distribution and cost impact (~510.66K).
Hiring Trends
Insight into recruitment needs by department, office, and seniority.
Objectives & Applications
Objective
To provide HR teams and management with real-time insights into workforce composition, contract types, salary structures, and talent performance for data-informed decisions.
Applications
HR Teams: Manage contracts, hiring timelines, and employee reviews.
Executives: Assess department-wise salary spending and performance gaps.
Recruiters: Monitor open positions, expected salary trends, and optimize time-to-hire.