Insurance Co. Agent Performance
Power BI Dashboards & Reports , , Links: Veiw
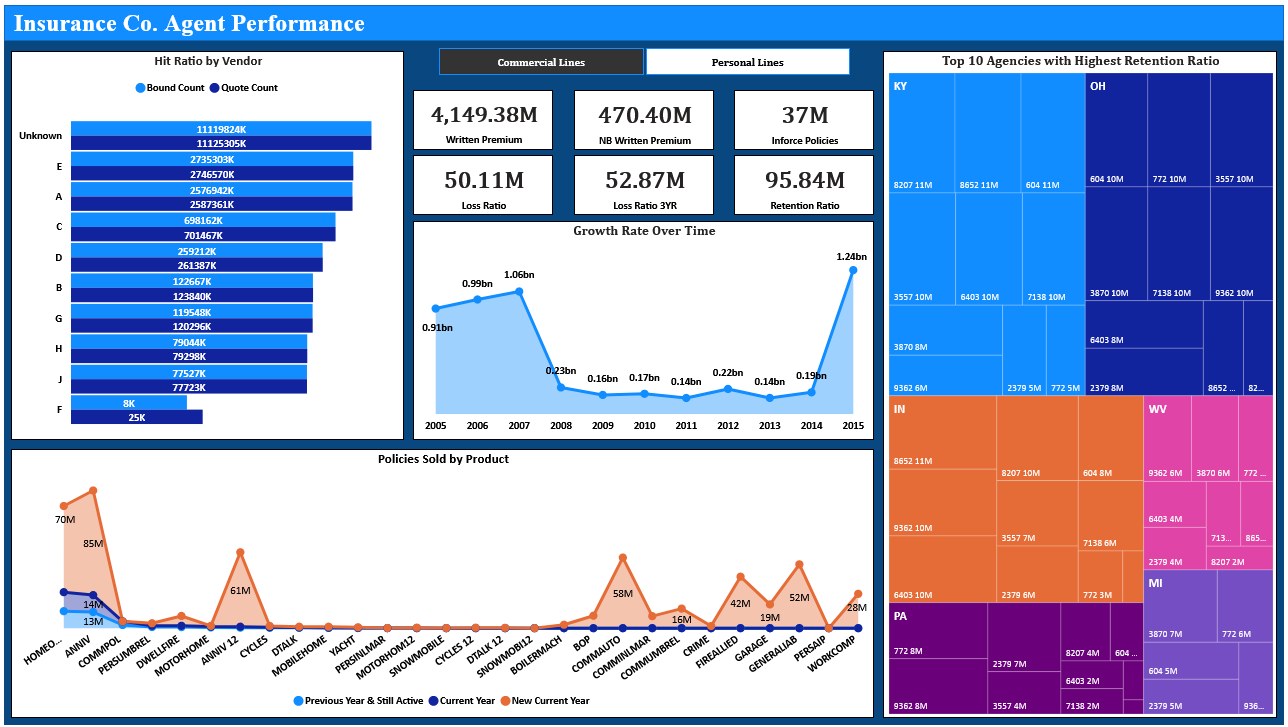
This dashboard provides a comprehensive analysis of the performance of agents in an insurance group comprising 10 property and casualty insurance, life insurance, and insurance brokerage companies. The dashboard focuses on key performance indicators (KPIs) to evaluate agent effectiveness and highlight areas for improvement.
Key Insights:
Hit Ratio by Vendor:
- Comparison of bound count and quote count across different vendors.
- Highlights top-performing vendors with significant hit ratios.
Financial Metrics:
- Commercial Lines:
- Written Premium: $4,149.38M
- NB Written Premium: $470.40M
- Inforce Policies: 37M
- Loss Ratio: 50.11M
- Loss Ratio (3-year): 52.87M
- Retention Ratio: 95.84M
- Commercial Lines:
Growth Rate Over Time:
- Analysis of growth rate from 2005 to 2015.
- Significant growth observed in 2015 with a premium of 1.24bn.
Top 10 Agencies with Highest Retention Ratio:
- Visualization of top agencies by state with highest retention ratios.
- Includes states like KY, OH, IN, WV, and MI.
Policies Sold by Product:
- Breakdown of policies sold across various products.
- Comparison between previous year, current year, and new current year policies.
- Notable products include HOMEO, COMMPO, and WORKCOMP with significant sales figures.
Objective:
The primary goal is to enhance agents’ existing knowledge and skills, using this data for agent segmentation in a supervised predictive framework. This helps in identifying top-performing agents, understanding market trends, and making informed decisions to boost overall performance across the insurance group.