Pharmaceutical Sales
Power BI Dashboards & Reports , , Links: Veiw
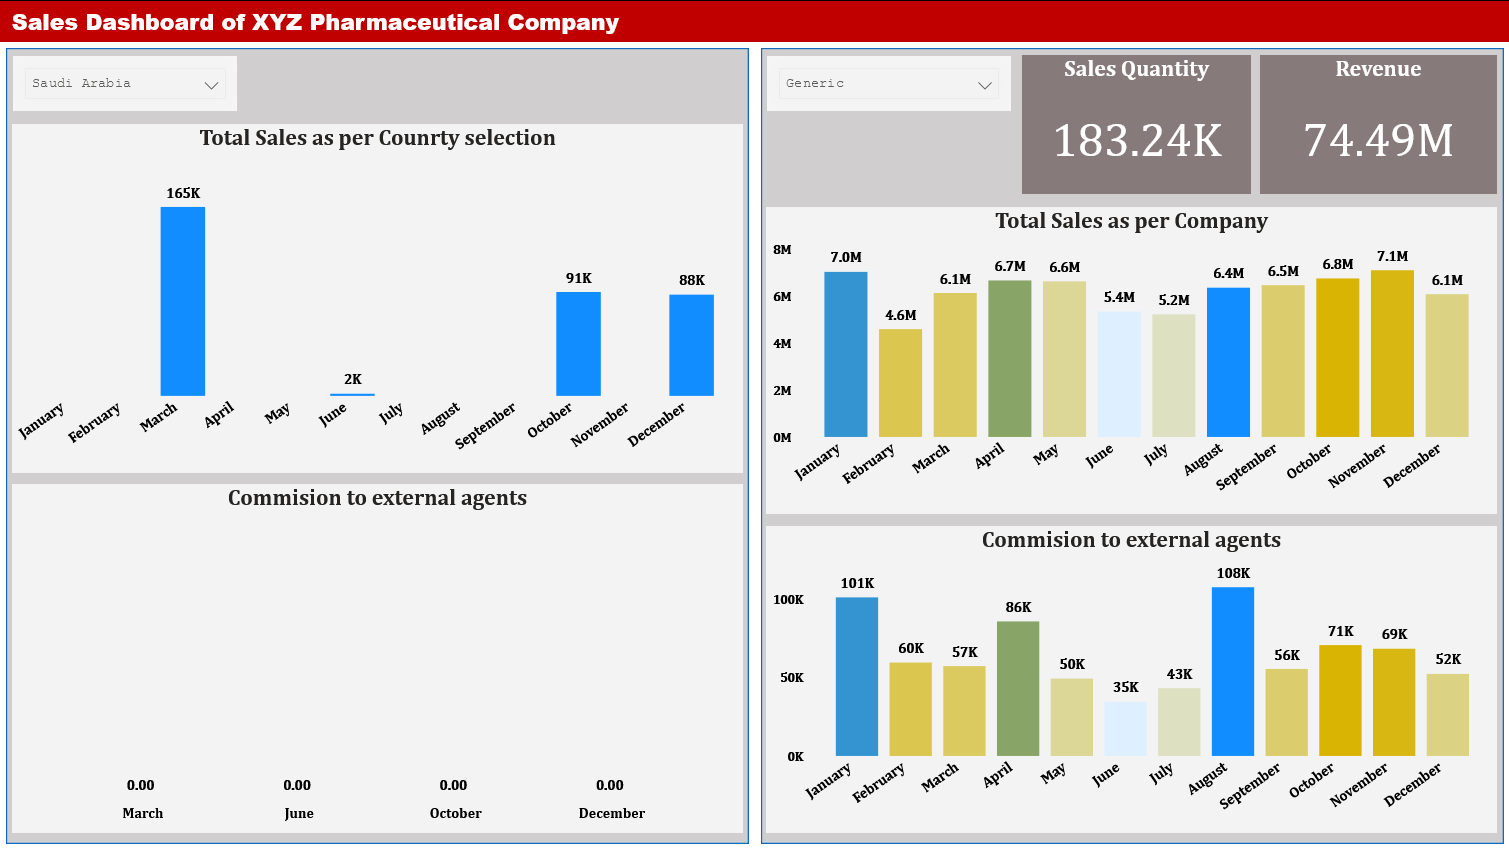
This dashboard is designed to analyze the sales performance of products across various regions and brands for a pharmaceutical company. It provides insights into sales quantities, revenue, and commissions to external agents, with user control functionality for easy data manipulation and visualization.
Key Insights:
Overall Metrics:
- Sales Quantity: 183.24K
- Revenue: $74.49M
Total Sales by Country:
- Sales data is displayed for different countries.
- Example (Saudi Arabia): March shows the highest sales at 165K, followed by October (91K) and November (88K).
Total Sales by Company:
- Monthly sales data across different companies.
- Example: January has the highest sales at $7.0M, followed by November ($6.8M) and December ($7.1M).
Commission to External Agents:
- Monthly commissions paid to external agents.
- Example: January has the highest commission at 101K, followed by August (108K) and April (86K).
User Control Functionality:
- Users can select different regions and brands to view specific data.
- Dropdowns allow for easy switching between country and brand views.
- Provides flexibility to analyze sales trends and commission data by brand and region.
This dashboard empowers the analytics team to gain valuable insights into sales performance and optimize strategies for various regions and brands, enhancing overall decision-making.