Property Rental Analytics Overview
Power BI Dashboards & Reports , , Links: Veiw
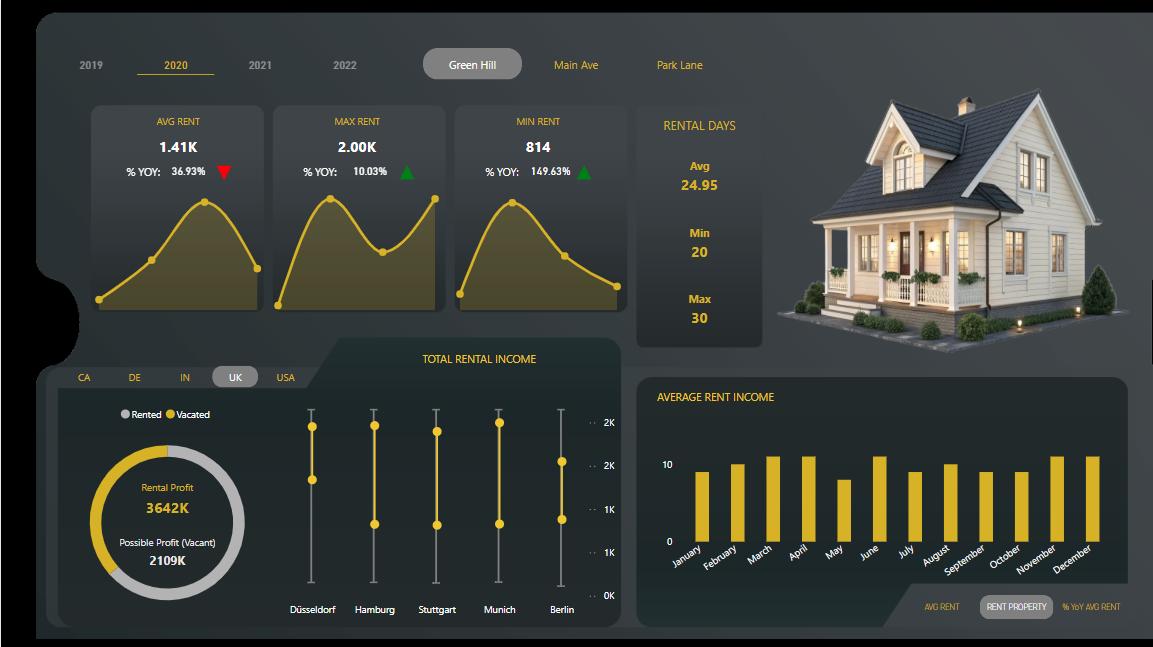
This dashboard provides a visual summary of key rental market metrics, including average rent, rental duration, income distribution, and profit potential. It helps property managers, investors, and analysts make informed decisions by highlighting trends, performance variations, and opportunities across different regions and time periods. Dashboard design inspired by DataTraining.io.
Key Insights:
Rental Performance Overview
- Average Rent: Indicates the standard market rate, essential for benchmarking property value and affordability.
- Maximum Rent: Helps identify premium property potential and peak seasonal pricing opportunities.
- Minimum Rent: Useful for detecting underperforming units or budget-friendly options.
- Year-over-Year Changes: Provide context for rent fluctuations and help assess market stability and growth potential.
Rental Duration Trends
- Average Rental Days: Reflect tenant commitment and market demand.
- Minimum & Maximum Days: Highlight variability across different units or time periods.
Profitability Insights
- Total Rental Profit: Represents actual income from occupied units.
- Potential Profit from Vacant Properties: Points to missed opportunities and areas for improvement in occupancy strategies.
- City/Region Breakdown: Enables location-specific analysis to inform future investments or marketing efforts.
Monthly Rent Income Patterns
Monthly trends help identify high-performing seasons and periods of lower activity, assisting in pricing strategy and resource planning. This can support targeted campaigns or rental promotions to maintain consistent income throughout the year.
Objectives of the Analysis
This analysis aims to provide a comprehensive overview of rental market performance, empowering property managers, investors, and analysts to:
- Optimize Pricing Strategies – Adjust rent based on real-time trends and seasonal demand.
- Improve Occupancy Rates – Identify and act on underperforming units.
- Support Investment Decisions – Focus efforts on high-yield locations and periods.
- Enhance Operational Planning – Use data to inform property management and marketing activities.
Applications
- Real Estate Companies: Strategic planning based on market data.
- Investors: Evaluate performance and return on investment.
- Analysts: Monitor rental trends and make data-driven forecasts.
Visual Dashboard Credit:
This dashboard visualization is inspired by DataTraining.io, known for creating powerful data-driven tools for learning and analysis.