Tableau Dashboards & Visual Analytics
Explore my diverse Tableau portfolio! Here, you’ll find a collection of my work using Tableau, a transformative tool that turns complex datasets into easy-to-understand visual stories. Each project is designed to uncover hidden patterns and trends, inspiring new ways of looking at data. From market analysis to customer segmentation and beyond, these visualizations demonstrate my skills in data blending, advanced calculations, and interactive storytelling. Explore the dashboards to see how data can be leveraged for meaningful business impacts.
2024
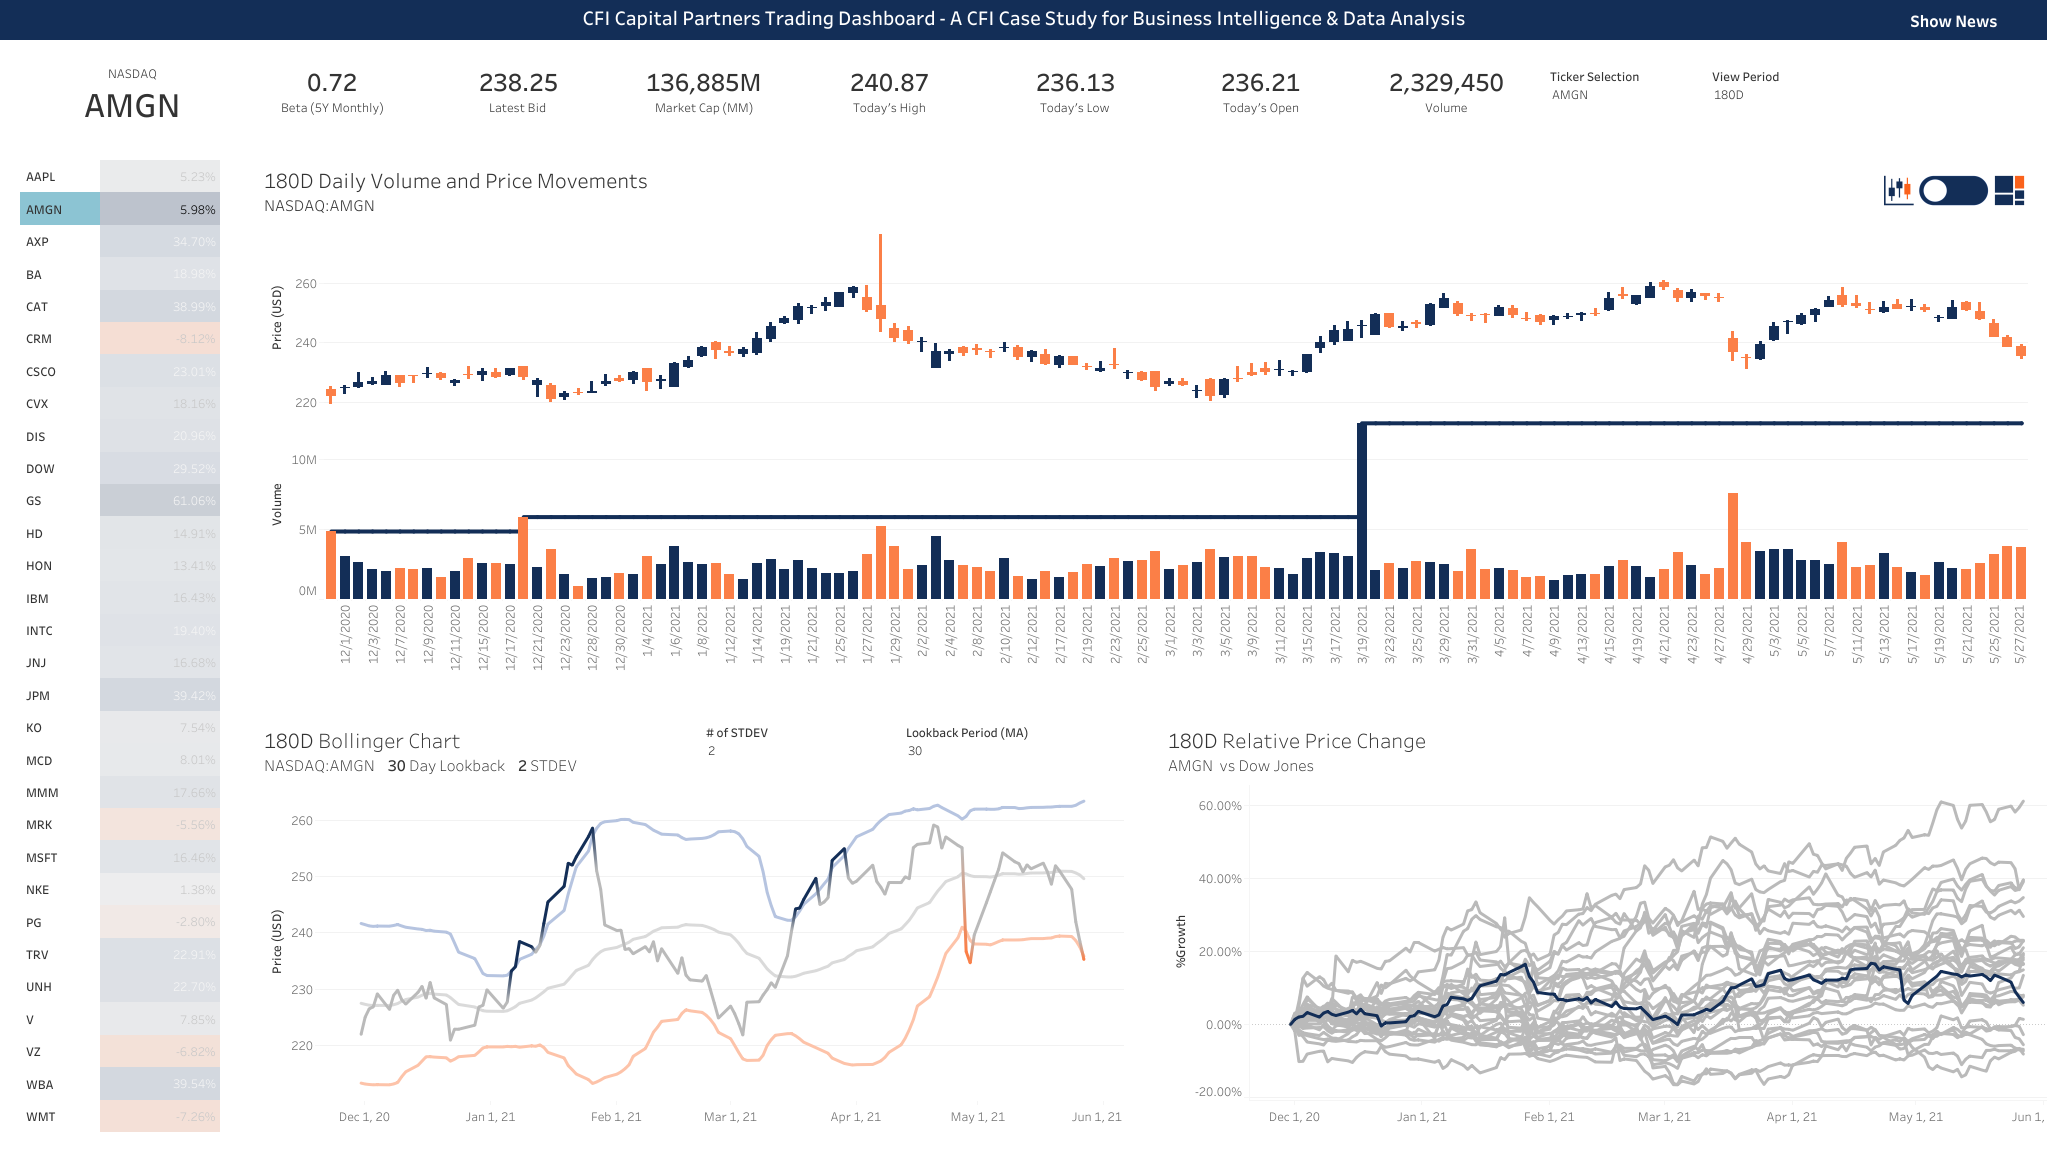
Dow Jones Technical Analysis
This dashboard facilitates a comprehensive technical analysis of AMGN stock performance using historical market data and key financial indicators. It helps in understanding trends, market behavior, and relative performance, providing valuable insights for traders, analysts, and investors. Continue reading Dow Jones Technical Analysis
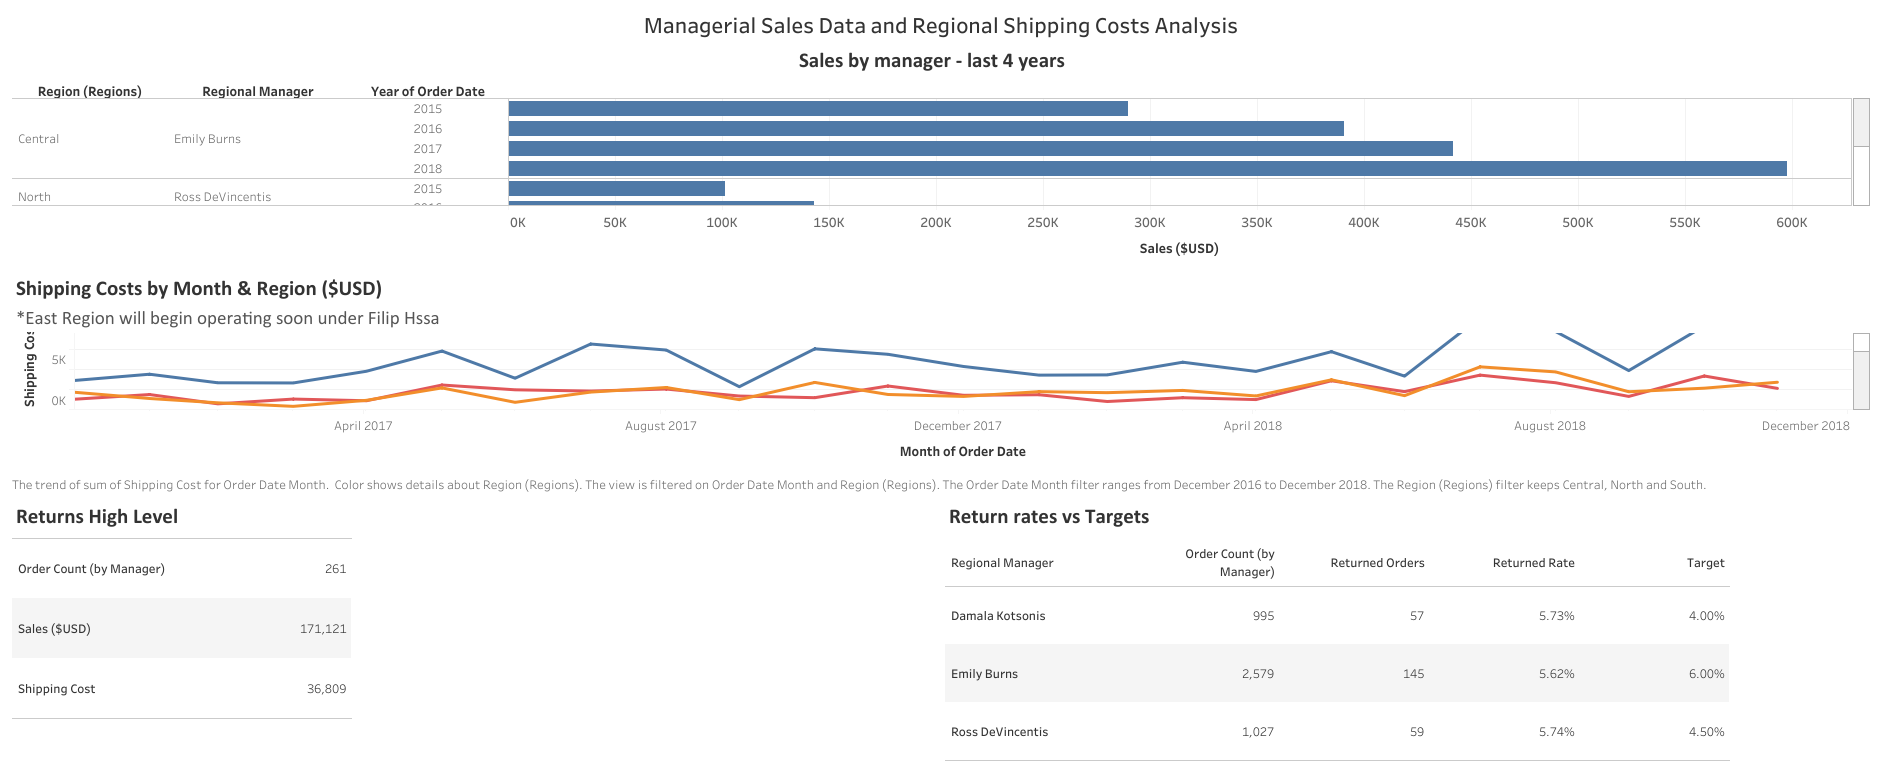
Regional Sales Metrics
This dashboard provides an in-depth analysis of sales performance, shipping costs, and return rates by region over the last four years. The visualizations offer insights into regional sales managed by different managers, monthly shipping expenses, and return metrics compared to targets. Continue reading Regional Sales Metrics
2022
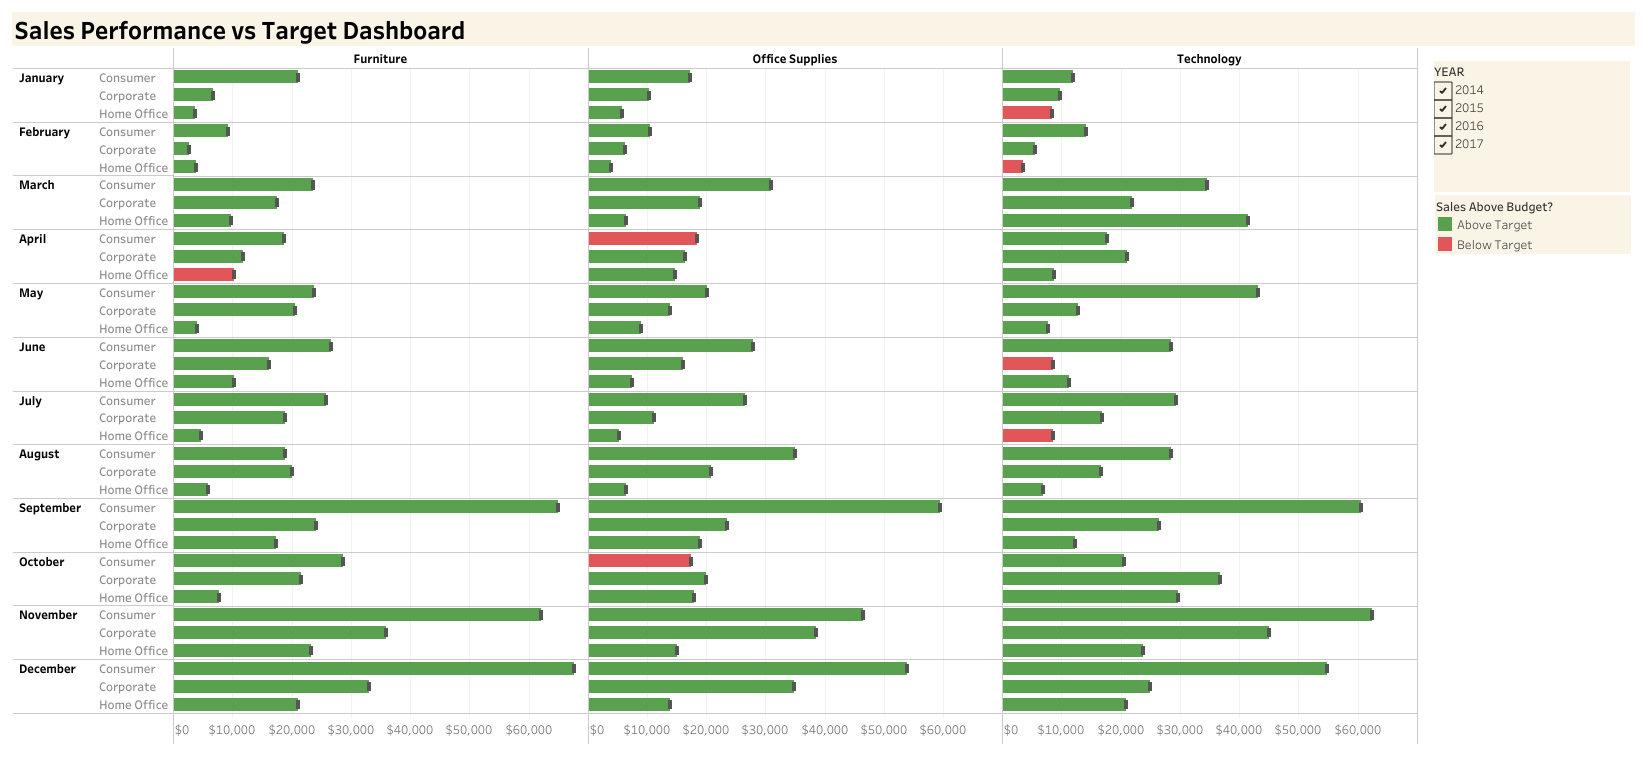
Sales Performance Analysis
This dashboard provides a detailed monthly analysis of sales performance by product segment (Consumer, Corporate, Home Office) and product category (Furniture, Office Supplies, Technology). It helps clients identify which segments and categories have met or exceeded their sales targets and which ones have not. Continue reading Sales Performance Analysis
2021
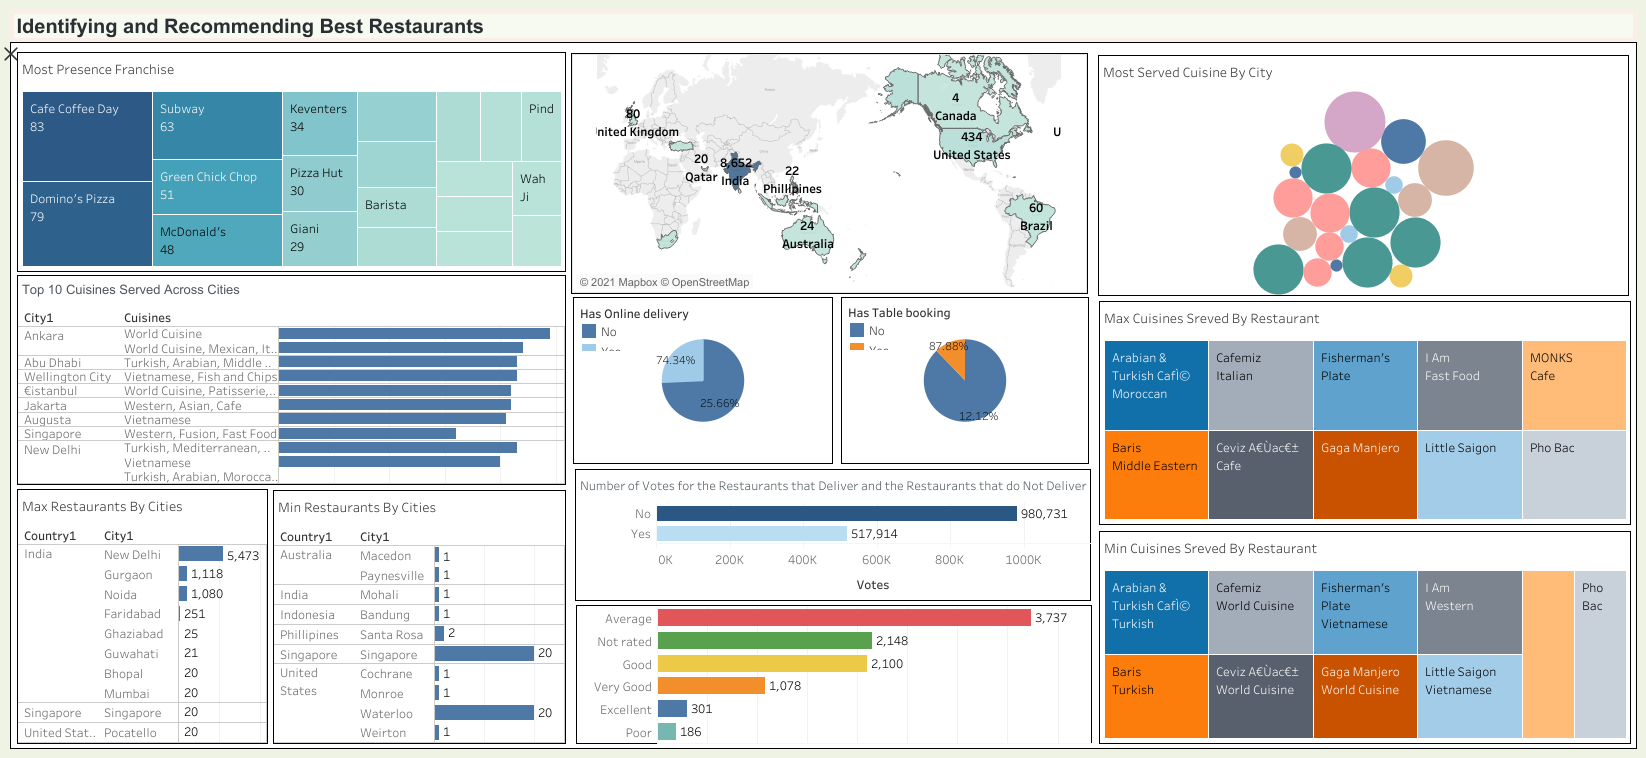
Identifying and Recommending Best Restaurants
This dashboard helps users explore restaurant data, providing a comprehensive understanding to identify “star” restaurants based on various metrics such as franchise presence, cuisine served, and customer preferences. Continue reading Identifying and Recommending Best Restaurants
2020
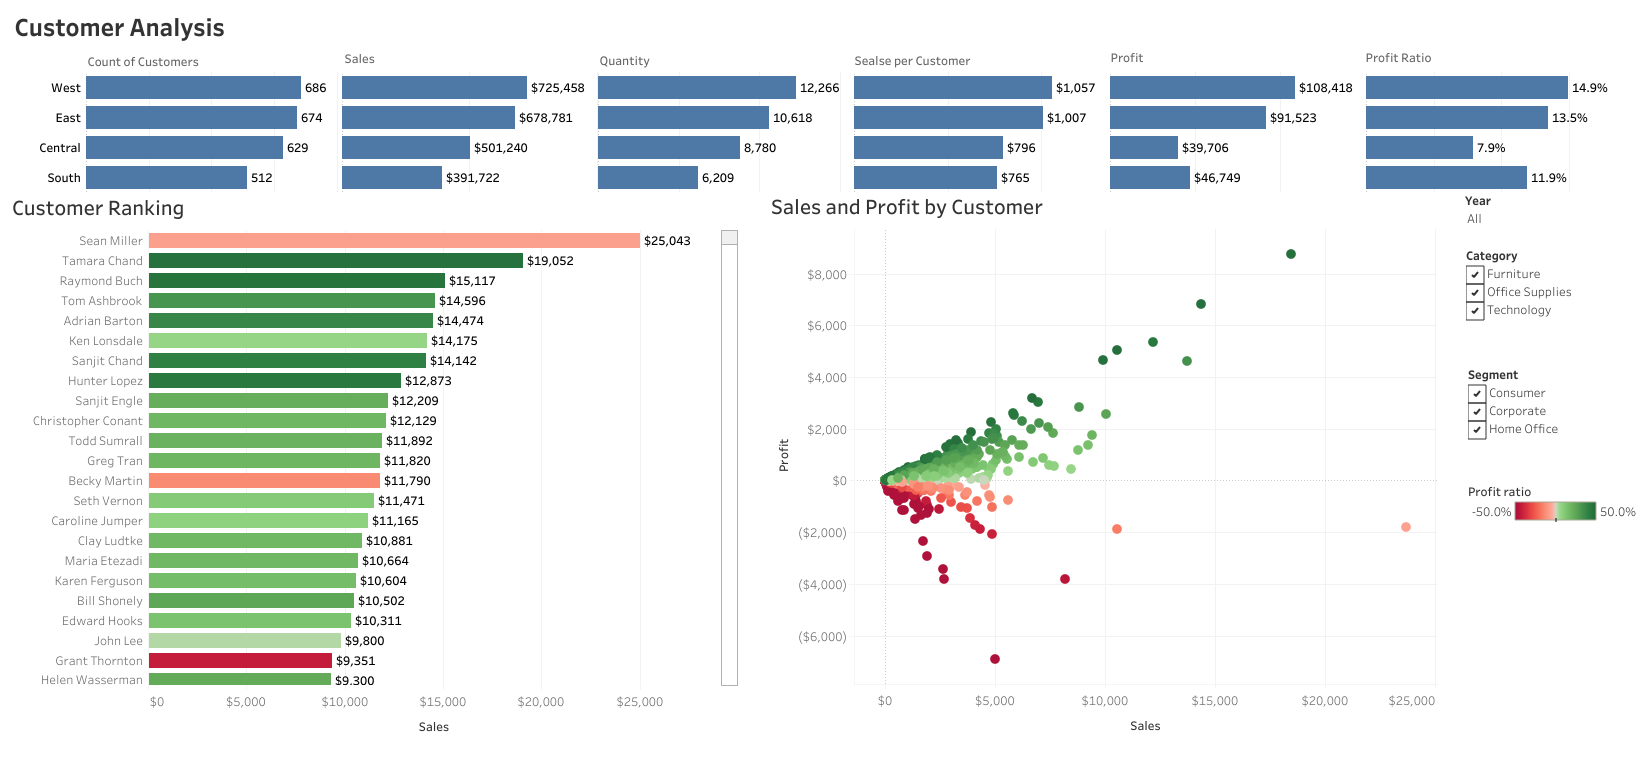
Customer Analysis
This dashboard provides a comprehensive analysis of retail products and company customer metrics across different regions. It aims to help users understand product performance, customer distribution, and regional differences. Continue reading Customer Analysis
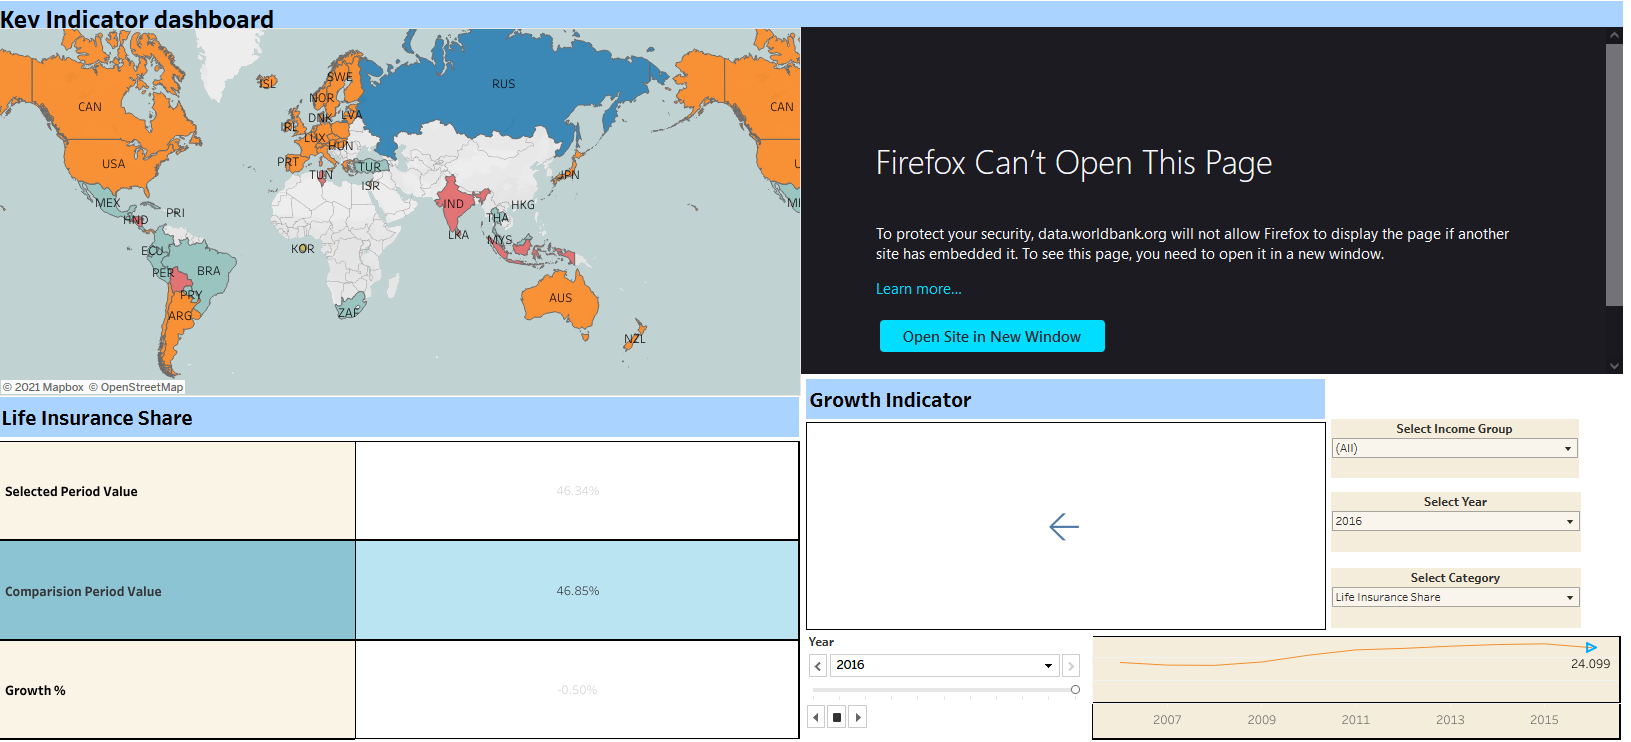
Comparative Study of Countries
This dashboard facilitates a comparative analysis of various parameters across different countries using sample insurance datasets and world development indicators. It helps in understanding global trends and performance in life insurance share and growth indicators. Continue reading Comparative Study of Countries