Dow Jones Technical Analysis
Tableau Dashboards & Visual Analytics , , Links: Veiw
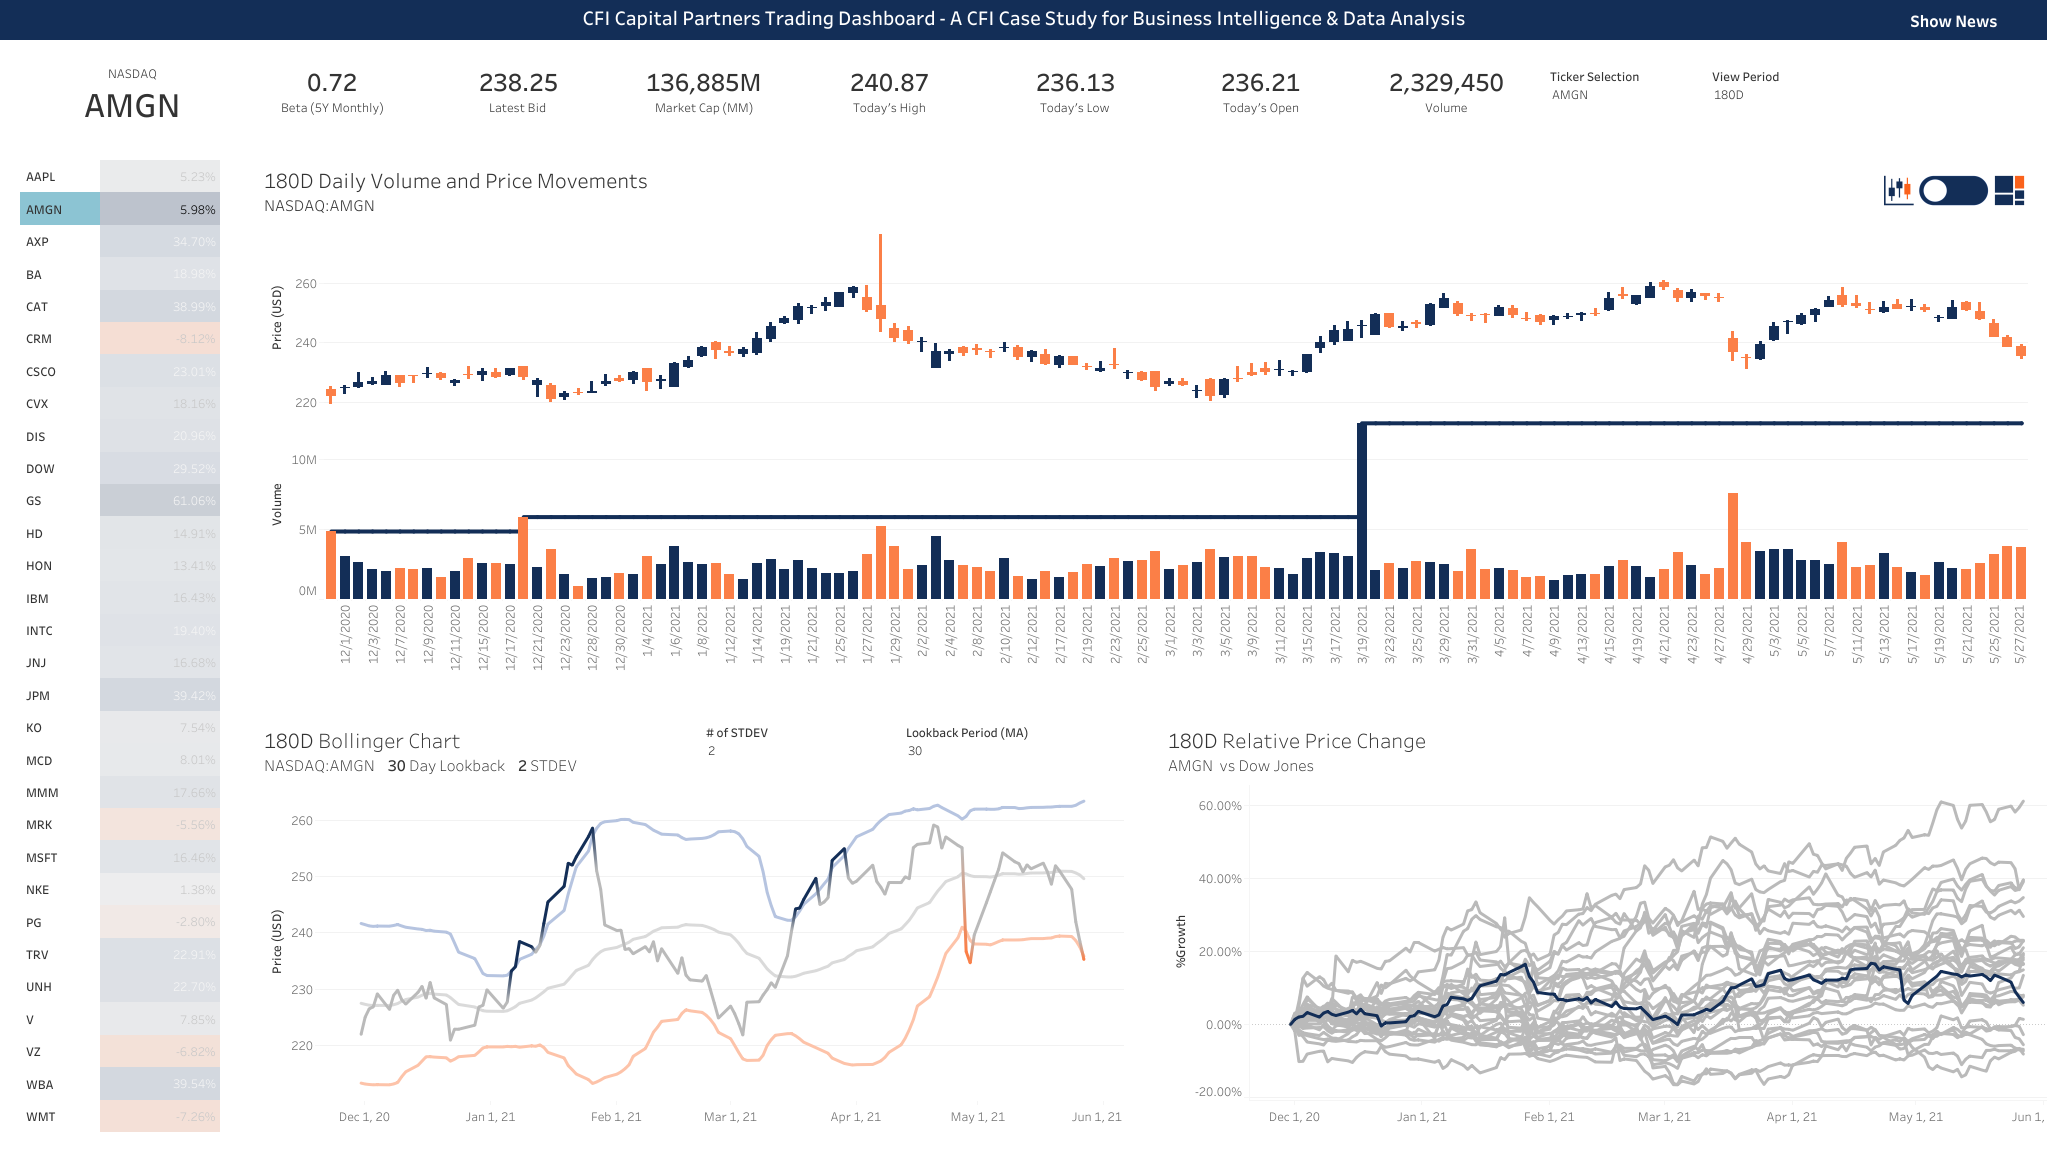
This dashboard facilitates a comprehensive technical analysis of AMGN stock performance using historical market data and key financial indicators. It helps in understanding trends, market behavior, and relative performance, providing valuable insights for traders, analysts, and investors.
Key Insights:
Global Overview:
- Ticker Selection and Custom View Periods:
- This feature allows users to select different tickers and adjust the view period for a customized analysis experience.
- A toggle button facilitates switching between candlestick and line chart views for enhanced data interpretation.
- Ticker Selection and Custom View Periods:
AMGN Stock Analysis:
180D Daily Volume and Price Movements: - Price Movements: A detailed candlestick chart showing AMGN’s daily stock prices over the past 180 days, including opening, closing, high, and low prices. - Volume Movements: Volume bars underneath the price chart display daily trading activity, providing insights into market liquidity.
180D Bollinger Chart: - Trend Analysis: Bollinger Bands with a 30-day lookback period and 2 standard deviations highlight AMGN’s price volatility and potential overbought/oversold conditions. - Standard Deviations: These bands help in identifying significant price movements and market trends.
180D Relative Price Change: - Comparison with Dow Jones: A line chart comparing AMGN’s price changes relative to the Dow Jones index over 180 days. - Performance Analysis: This helps in understanding AMGN’s market position and overall performance in comparison to a major market index.
User Controls:
Ticker Selection: - Users can choose different stock tickers to analyze specific companies. View Period Adjustment: - Enables selection of different time periods for a tailored analysis. Chart Type Toggle: - Switch between candlestick and line charts for different visual perspectives.
Objective:
The primary goal of this dashboard is to provide a comprehensive technical analysis of AMGN, offering insights into its market behavior and performance. By examining historical data and key metrics, users can identify trends, compare relative performance, and make informed investment decisions.
Target Audience:
This tool is invaluable for traders, analysts, and investors seeking to explore detailed stock performance metrics, understand market trends, and enhance their decision-making process based on robust data analysis.