Regional Sales Metrics
Tableau Dashboards & Visual Analytics , , Links: Veiw

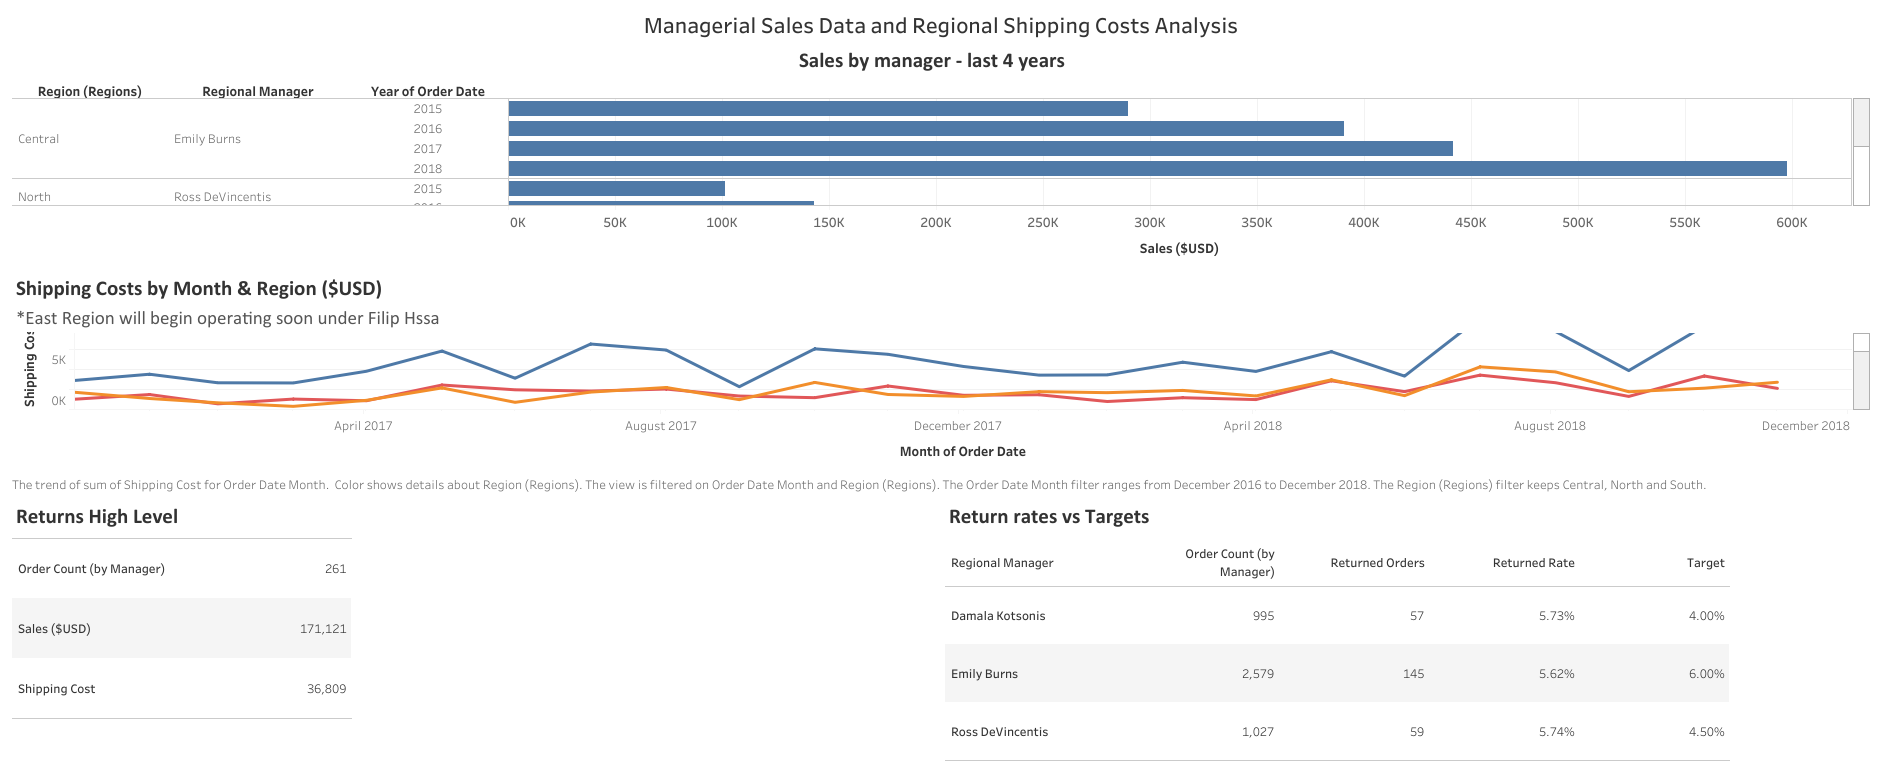
This dashboard provides an in-depth analysis of sales performance, shipping costs, and return rates by region over the last four years. The visualizations offer insights into regional sales managed by different managers, monthly shipping expenses, and return metrics compared to targets.
Key Insights:
- Sales Performance by Manager and Year:
- Sales Analysis: A bar chart showcasing sales figures for each manager in the Central, North, and South regions over the past four years.
- Comparative Insights: Allows for quick comparison of sales performance across different years and managers.
- Shipping Costs by Month and Region:
- Trend Analysis: A line chart depicting monthly shipping costs for Central, North, and South regions from December 2016 to December 2018.
- Upcoming Operations: Note that the East region will begin operations soon under Filip Hssa, indicating future expansion.
- Returns Analysis:
- High-Level Overview: A summary of order counts and returns, giving a quick snapshot of return rates.
- Return Rates vs. Targets: Comparison of returned order rates against set targets for different regional managers.
Objective:
The primary goal of this dashboard is to provide a comprehensive overview of sales, shipping costs, and return rates to identify trends, measure performance, and support decision-making processes.
Target Audience:
This tool is valuable for sales managers, regional directors, and operations analysts seeking to optimize sales strategies, manage shipping costs effectively, and improve return rate performance based on detailed data insights.
