Sales Performance Analysis
Tableau Dashboards & Visual Analytics , , Links: Veiw
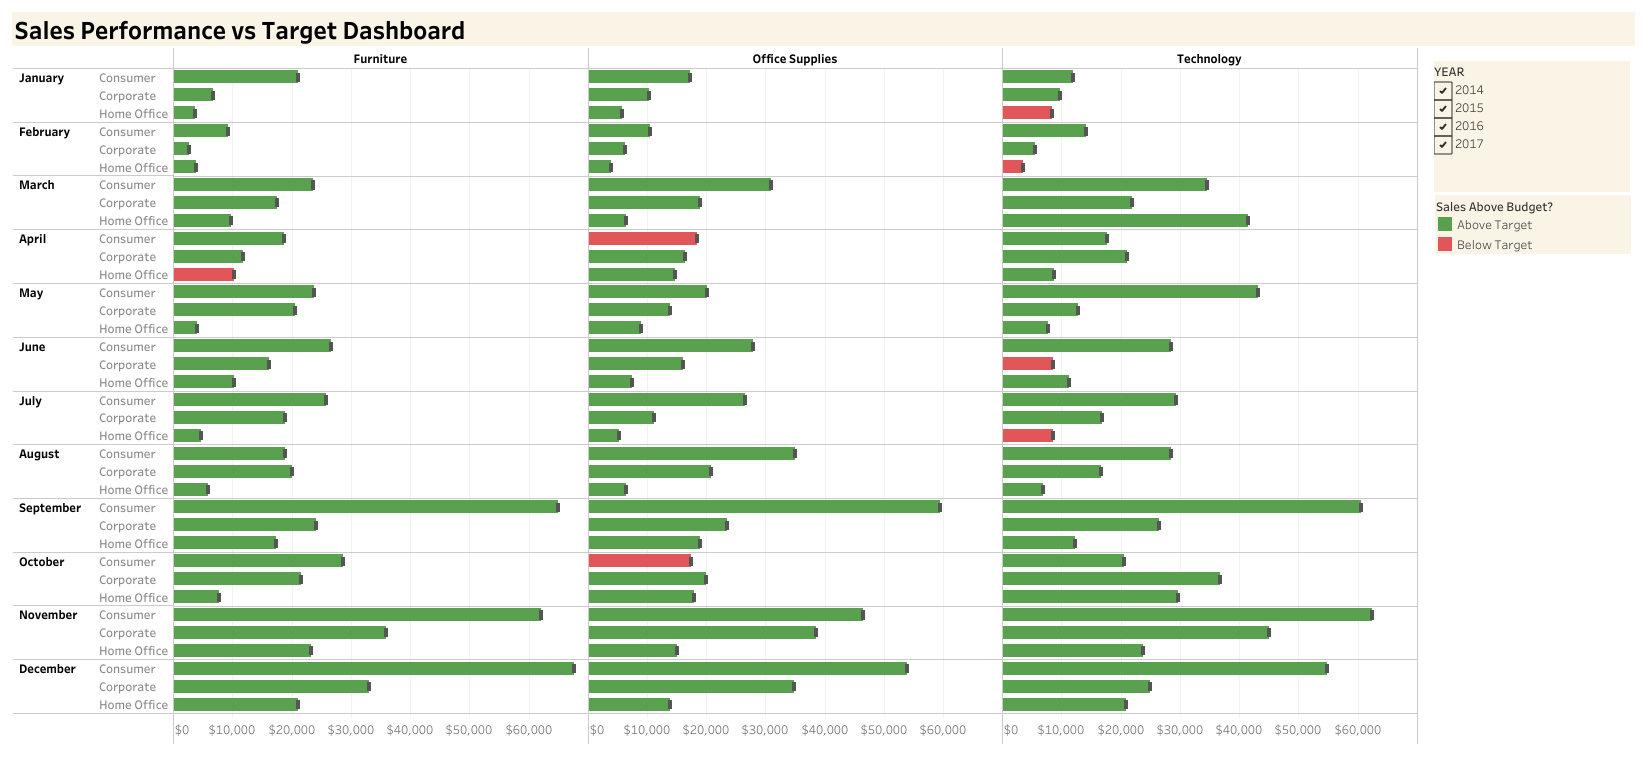
This dashboard provides a detailed monthly analysis of sales performance by product segment (Consumer, Corporate, Home Office) and product category (Furniture, Office Supplies, Technology). It helps clients identify which segments and categories have met or exceeded their sales targets and which ones have not.
Key Insights:
Monthly Performance:
- Furniture:
- Consistently high performance in several months, especially March, June, and December.
- Below target in April for Home Office segment.
- Office Supplies:
- Steady performance throughout the year with some months exceeding targets significantly.
- Below target in April for Corporate segment.
- Technology:
- Strong performance with several months exceeding targets, notably in March, June, and December.
- Below target in multiple months, indicating potential areas for improvement.
- Furniture:
Sales Targets:
- Sales are compared against targets, with green bars indicating above-target performance and red bars indicating below-target performance.
- Allows quick identification of successful and underperforming segments and categories.
Yearly Filters:
- The dashboard includes filters to view data for specific years (2014, 2015, 2016, 2017).
- Provides flexibility to analyze trends and performance over different years.
Objective:
The primary aim is to enable clients to easily identify the product segments and categories that are performing well and those that need attention. By understanding these trends, clients can make informed decisions to improve sales strategies, allocate resources effectively, and achieve better overall performance.
This dashboard serves as a powerful tool for sales managers and executives, providing the necessary insights to drive strategic initiatives and boost sales performance across various segments and categories.